Unlock a world of possibilities! Login now and discover the exclusive benefits awaiting you.
- Qlik Community
- :
- All Forums
- :
- QlikView App Dev
- :
- Line chart functionality question
- Subscribe to RSS Feed
- Mark Topic as New
- Mark Topic as Read
- Float this Topic for Current User
- Bookmark
- Subscribe
- Mute
- Printer Friendly Page
- Mark as New
- Bookmark
- Subscribe
- Mute
- Subscribe to RSS Feed
- Permalink
- Report Inappropriate Content
Line chart functionality question
Hello,
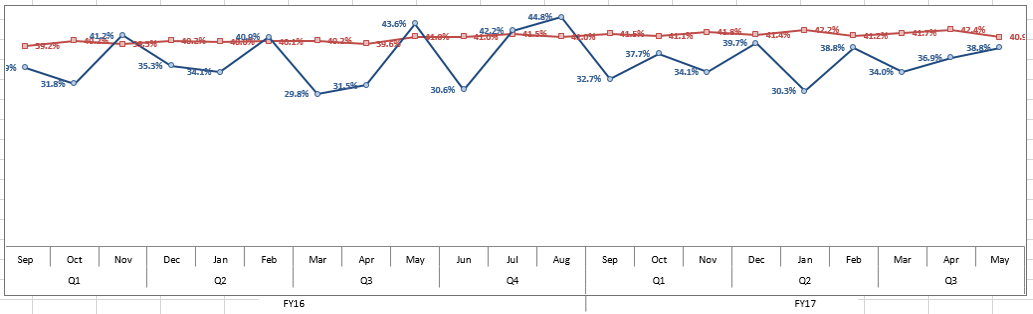
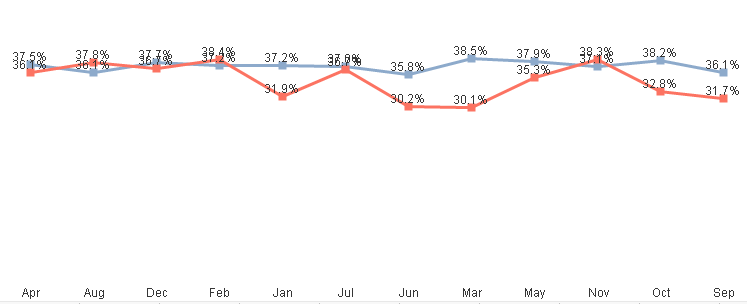
I'm writing with a question about the line chart. We have a requirement to duplicate what we have in excel where it is grouped by FY, Quarter, and Months. showing all at the same time. I attached screenshots below, on my Qlik version I'm not able to duplicate the way it is grouped, can you help me with this? Also, is it possible to move the values on the data points so that those on the blue line will be above the line and those on the red line will be below?
Thank you so much in advance,
Roebrich Perez
Excel:
Qlik:
- Mark as New
- Bookmark
- Subscribe
- Mute
- Subscribe to RSS Feed
- Permalink
- Report Inappropriate Content
Hello Roebrich,
check this thread:
How to have 2 fields in the X axis of a graph
there is an example where they concatenated the fields you want to Display on x-axis.
You should be able to adapt that to 3 fields.