Unlock a world of possibilities! Login now and discover the exclusive benefits awaiting you.
- Qlik Community
- :
- All Forums
- :
- QlikView App Dev
- :
- Line chart to display all months Jan to Dec
- Subscribe to RSS Feed
- Mark Topic as New
- Mark Topic as Read
- Float this Topic for Current User
- Bookmark
- Subscribe
- Mute
- Printer Friendly Page
- Mark as New
- Bookmark
- Subscribe
- Mute
- Subscribe to RSS Feed
- Permalink
- Report Inappropriate Content
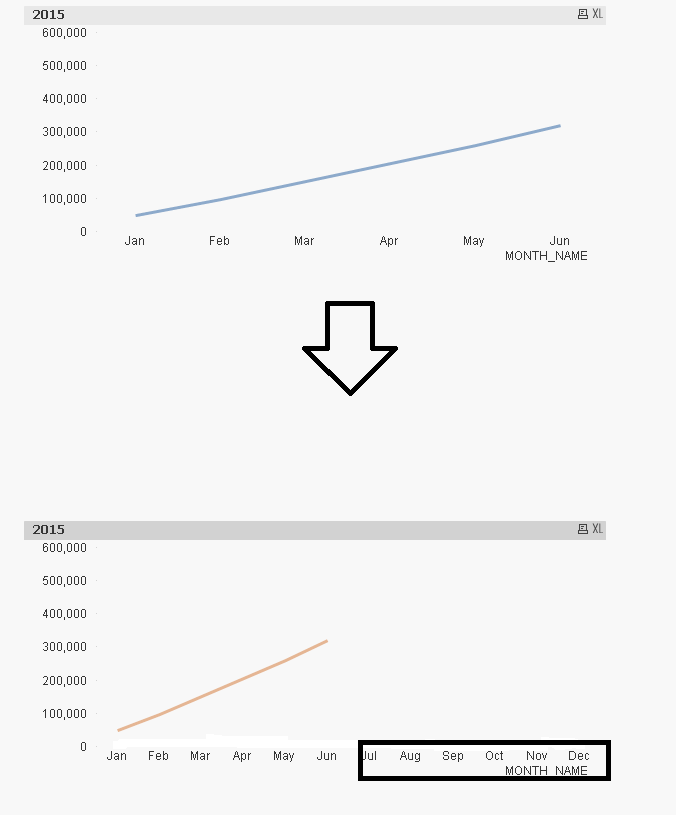
Line chart to display all months Jan to Dec
Hi,
I want my line chart to look like this ( see fig the resulting chart should look like the chart at the bottom with all the months present.
Accepted Solutions
- Mark as New
- Bookmark
- Subscribe
- Mute
- Subscribe to RSS Feed
- Permalink
- Report Inappropriate Content
I was able to achieve the result by adding a expression that gave values for previous years,then unchecking all the options under the display options in expressions tab of the line chart properties.
- Mark as New
- Bookmark
- Subscribe
- Mute
- Subscribe to RSS Feed
- Permalink
- Report Inappropriate Content
Uncheck "suppress zero values" on the presentation tab in the chart properties.
- Mark as New
- Bookmark
- Subscribe
- Mute
- Subscribe to RSS Feed
- Permalink
- Report Inappropriate Content
Thanks for the response Mike.
I already tried that, the problem with Uncheck "suppress zero values" is, it shows an green line which I dont want as it misleads the business users ( see the =attached app).is there a way to supress the green line ?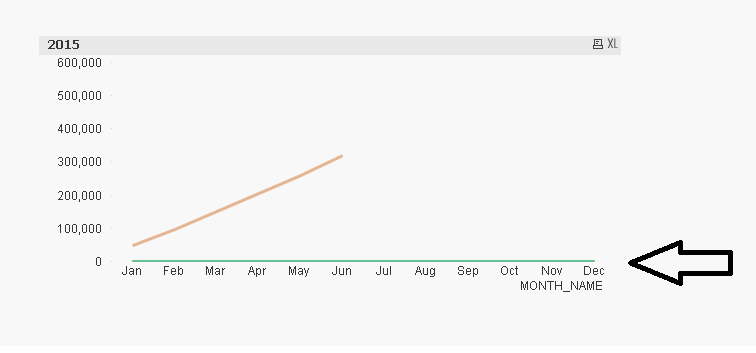
- Mark as New
- Bookmark
- Subscribe
- Mute
- Subscribe to RSS Feed
- Permalink
- Report Inappropriate Content
I was able to achieve the result by adding a expression that gave values for previous years,then unchecking all the options under the display options in expressions tab of the line chart properties.