Unlock a world of possibilities! Login now and discover the exclusive benefits awaiting you.
- Qlik Community
- :
- All Forums
- :
- QlikView App Dev
- :
- Line chart with avg line across dimensions + min a...
- Subscribe to RSS Feed
- Mark Topic as New
- Mark Topic as Read
- Float this Topic for Current User
- Bookmark
- Subscribe
- Mute
- Printer Friendly Page
- Mark as New
- Bookmark
- Subscribe
- Mute
- Subscribe to RSS Feed
- Permalink
- Report Inappropriate Content
Line chart with avg line across dimensions + min and max values
all,
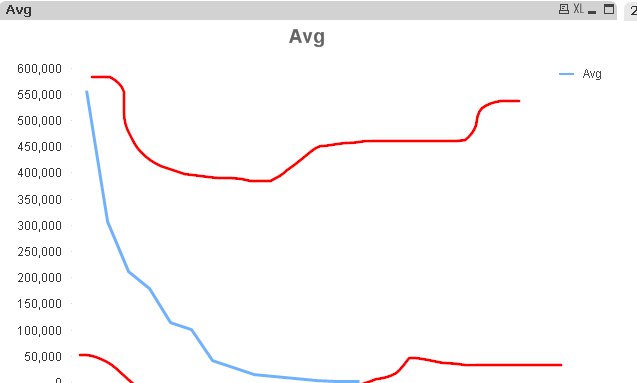
I have a chart shown below with an average expression across a dimensions on the bottom. The two red lines is what i would like to show. I want these red lines to me the MAX and the MIN for the given dimension where that AVG line hits. Let me know if you have any questions. Basically find the avg (expression) across the dimension but then have two complimentary lines for that dimension that show the Max value and Min value that the expressions is averaging.
Blue = Avg line expression
Red- Max and Min (drawn out) but end goal for expression. Max and min value off of the avg value for the dimension
- Tags:
- line chart
- max
- min
- Mark as New
- Bookmark
- Subscribe
- Mute
- Subscribe to RSS Feed
- Permalink
- Report Inappropriate Content
If your expression is
avg(value)
then add two more expressions:
min(value)
max(value)
Or am I missing something?
-Rob
- Mark as New
- Bookmark
- Subscribe
- Mute
- Subscribe to RSS Feed
- Permalink
- Report Inappropriate Content
That will create a static line for both. I want to take the Max(Value) + Min(Value) of the Value that was Averages for the specific dimension. I think I got it to work with aggr by the dimension but the axes have to large of a variance between the two.