Unlock a world of possibilities! Login now and discover the exclusive benefits awaiting you.
- Qlik Community
- :
- All Forums
- :
- QlikView App Dev
- :
- Line graph with multiple Dimension and Expression ...
Options
- Subscribe to RSS Feed
- Mark Topic as New
- Mark Topic as Read
- Float this Topic for Current User
- Bookmark
- Subscribe
- Mute
- Printer Friendly Page
Turn on suggestions
Auto-suggest helps you quickly narrow down your search results by suggesting possible matches as you type.
Showing results for
Creator II
2017-03-13
03:58 AM
- Mark as New
- Bookmark
- Subscribe
- Mute
- Subscribe to RSS Feed
- Permalink
- Report Inappropriate Content
Line graph with multiple Dimension and Expression in Qliksense
Hi,
i have a line chart where i am showing data weekly, Now i need it to display line chart, showing dimension with both weekly and Monthly as shown in below figure
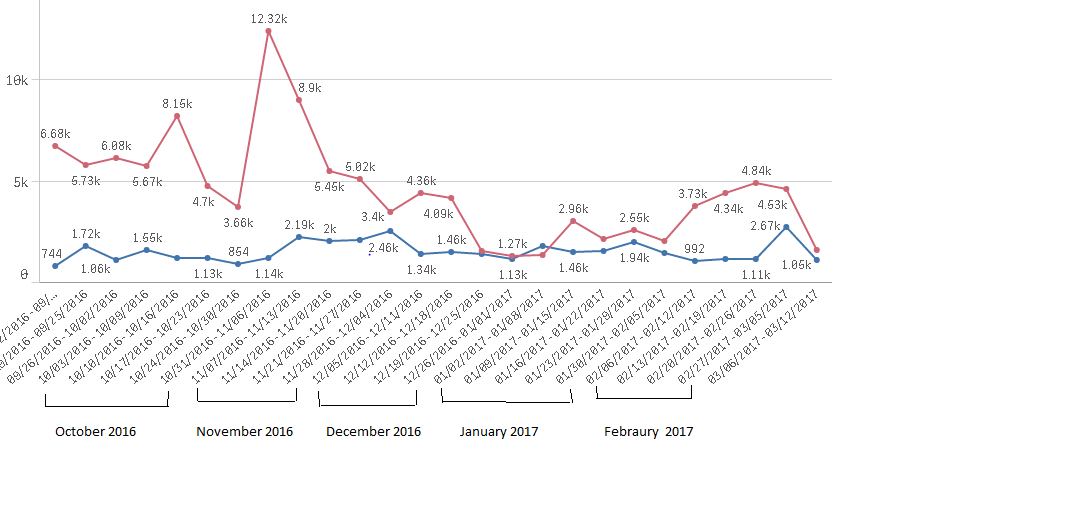
In Load script
LOAD UserType,
Date(Date#(Date,'YYYYMMDD'),'MM-DD-YYYY') as DateLink,
Hits,
Bounced,
date(WeekStart(Date#(Date,'YYYYMMDD')), 'MM/DD/YYYY') &' - '& date(WeekEnd(Date#(Date,'YYYYMMDD')), 'MM/DD/YYYY') as Weekly_Dates,
week(Date#(Date,'YYYYMMDD')) as week_number;
SQL SELECT UserType,
Date,
Bounced,
Hits
FROM ViewTrafficTable;
In front end
Dimension: Weekly_Dates
Expression 1: Sum(Hits)
Expression 2: Sum(Bounced)
Please help on this.
- Tags:
- dim group
- line grpah
751 Views
0 Replies