Unlock a world of possibilities! Login now and discover the exclusive benefits awaiting you.
- Qlik Community
- :
- All Forums
- :
- QlikView App Dev
- :
- Linear gauge in straight table
- Subscribe to RSS Feed
- Mark Topic as New
- Mark Topic as Read
- Float this Topic for Current User
- Bookmark
- Subscribe
- Mute
- Printer Friendly Page
- Mark as New
- Bookmark
- Subscribe
- Mute
- Subscribe to RSS Feed
- Permalink
- Report Inappropriate Content
Linear gauge in straight table
Hi,
I have some problems with the display of the length of each linear gauge in a straight table with a drill-down dimension.
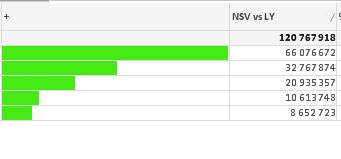
This first picture above shows the result in the first stage of the drill-down. This looks nice, the row with the highest value is 100% filled.
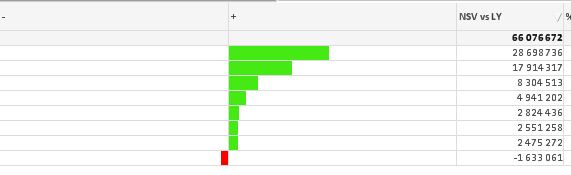
The next picture show the second stage of the drill-down. As you see now the row with the highest value is not 100% filled, instead its filled as the amount of the total amount.
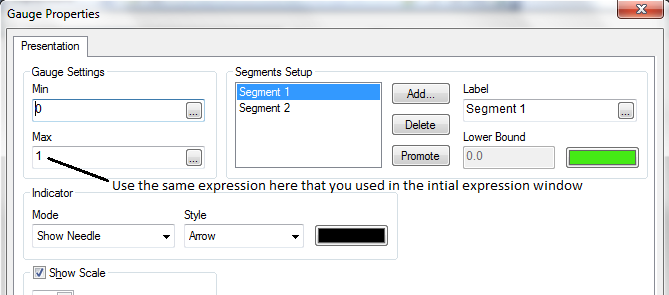
The code below is what I have implemented in the box for max in Gauge Properties.
RangeMax(
Alt(max(
TOTAL Aggr($(v_GSV_CPPeriod_vs_GSV_LYPeriod_Positive), [Salesorganisation Name])), 1),
Alt(min(
TOTAL Aggr($(v_GSV_CPPeriod_vs_GSV_LYPeriod_Negative), [Salesorganisation Name]))*-1, -1)
)
The other columns in the drill-down is [Customer Group Name] and [Customer Name].
I would like to fill the row with the highest value to 100% everytime, regardless of which stage of drill-down. How can I change the script to enable this?
Thanks in advance,
Fredrik
- Mark as New
- Bookmark
- Subscribe
- Mute
- Subscribe to RSS Feed
- Permalink
- Report Inappropriate Content
I guess, you need to edit the expression that you have used in the below space.
Hope that helps.
Regards,
Aadil
- Mark as New
- Bookmark
- Subscribe
- Mute
- Subscribe to RSS Feed
- Permalink
- Report Inappropriate Content
Hi,
That does not work. I the initial express window I only implement the variable $(v_GSV_CPPeriod_vs_GSV_LYPeriod_Positive) for the green line and $(v_GSV_CPPeriod_vs_GSV_LYPeriod_Negative) for the red line.
- Mark as New
- Bookmark
- Subscribe
- Mute
- Subscribe to RSS Feed
- Permalink
- Report Inappropriate Content
can you post a sample app.. it will be easier that way... 
- Mark as New
- Bookmark
- Subscribe
- Mute
- Subscribe to RSS Feed
- Permalink
- Report Inappropriate Content
Hi,
Attached is a sample app. I want regardless of the level off drill-down that the row with the highest value in either +/- will be 100% filled.
Thanks,