Unlock a world of possibilities! Login now and discover the exclusive benefits awaiting you.
- Qlik Community
- :
- All Forums
- :
- QlikView App Dev
- :
- Re: Linking tables without association
- Subscribe to RSS Feed
- Mark Topic as New
- Mark Topic as Read
- Float this Topic for Current User
- Bookmark
- Subscribe
- Mute
- Printer Friendly Page
- Mark as New
- Bookmark
- Subscribe
- Mute
- Subscribe to RSS Feed
- Permalink
- Report Inappropriate Content
Linking tables without association
Hi all,
I am trying to link two table together while on purpose not having them join/associate.
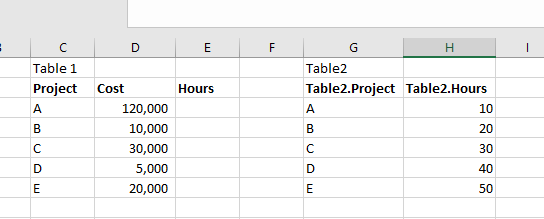
Let me explain based on example below. I have two table (Table 1 and Table 2). Both have a project column with the same values in them. So obviously, I could have both tables join/associate in Qlikview and link them up. I have a specific reason that I don't want to do that so in order to avoid this to happen, I qualified Table 2 in the loading script.
Now that that is done, I do would like the hours from Table 2 to appear in Table 1. I was thinking I can maybe do this by capturing the project letter of Table 1 and use that in a set analysis to sum the hours but not sure how to do that. I tried this expression in Table 1 but it is not working:
=sum({<Table2.Project = {'Project'}>} Table2.Hours)
Any ideas? Many thanks in advance.
- « Previous Replies
-
- 1
- 2
- Next Replies »
- Mark as New
- Bookmark
- Subscribe
- Mute
- Subscribe to RSS Feed
- Permalink
- Report Inappropriate Content
Maybe like
=sum({<Table2.Project = p(Project) >} Table2.Hours)
But this will not group the Table2.Project values if used in a chart with dimension Project.
You would need something like
=Sum( If(Table2.Project = Project, Table2.Hours))
This will create a cartesian join on runtime.
- Mark as New
- Bookmark
- Subscribe
- Mute
- Subscribe to RSS Feed
- Permalink
- Report Inappropriate Content
Hi Stefan,
This works. Many, many thanks!
Danny
- Mark as New
- Bookmark
- Subscribe
- Mute
- Subscribe to RSS Feed
- Permalink
- Report Inappropriate Content
Stefan,
One more quick question; I used your suggested formula to come to a solution:
=Sum( If(Table2.Project = Project, Table2.Hours))
However, I actually have two criteria to fulfil; the first one is Table2.Project = Project but I also have a second where Table2.Phase = Phase.
I adapted your formula to read like the one below, but rather than creating a smaller subset, it creates a much bigger one. Any thoughts?
=Sum( If(Table2.Project = Project, if(Table2.Phase = Phase, Table2.Hours)))
Thanks,
Danny
- Mark as New
- Bookmark
- Subscribe
- Mute
- Subscribe to RSS Feed
- Permalink
- Report Inappropriate Content
Well, not 100% sure. I usually avoid using these kind of unlinked tables.
Try maybe
=Sum( If(Table2.Project & '-' & Table2.Phase = Project &'-'& Phase, Table2.Hours))
Or
Sum(
Aggr(
If (Table2.Project = Project and Table2.Phase = Phase, Table2.Hours),
Table2.Project, Table2.Phase, Project, Phase)
)
If one of these work, you can add set analysis to limit the possible combinations of the run time JOIN:
{<Table2.Project = p(Project), Table2.Phase = p(Phase) >}
- Mark as New
- Bookmark
- Subscribe
- Mute
- Subscribe to RSS Feed
- Permalink
- Report Inappropriate Content
Thanks Stefan. but neither of the options worked. This is what I have (I used the real fields so I don't have to keep converting).
Any suggestions are welcome, in the meantime I'll keep looking.
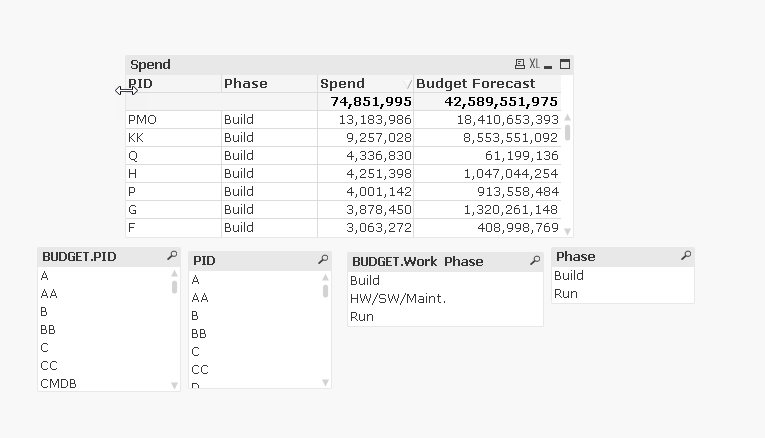
=sum({$<[BUDGET.Expense Category]={'Labor - Client Service'}, BUDGET.PID = p(PID), [BUDGET.Work Phase] = p(Phase)>} if(BUDGET.PID&'-'&[BUDGET.Work Phase] = PID&'-'&Phase, BUDGET.FY19))
Thanks!
- Mark as New
- Bookmark
- Subscribe
- Mute
- Subscribe to RSS Feed
- Permalink
- Report Inappropriate Content
"Work Phase" and "Phase" show the same values?
Can you upload a simplified sample QVF or some screenshots?
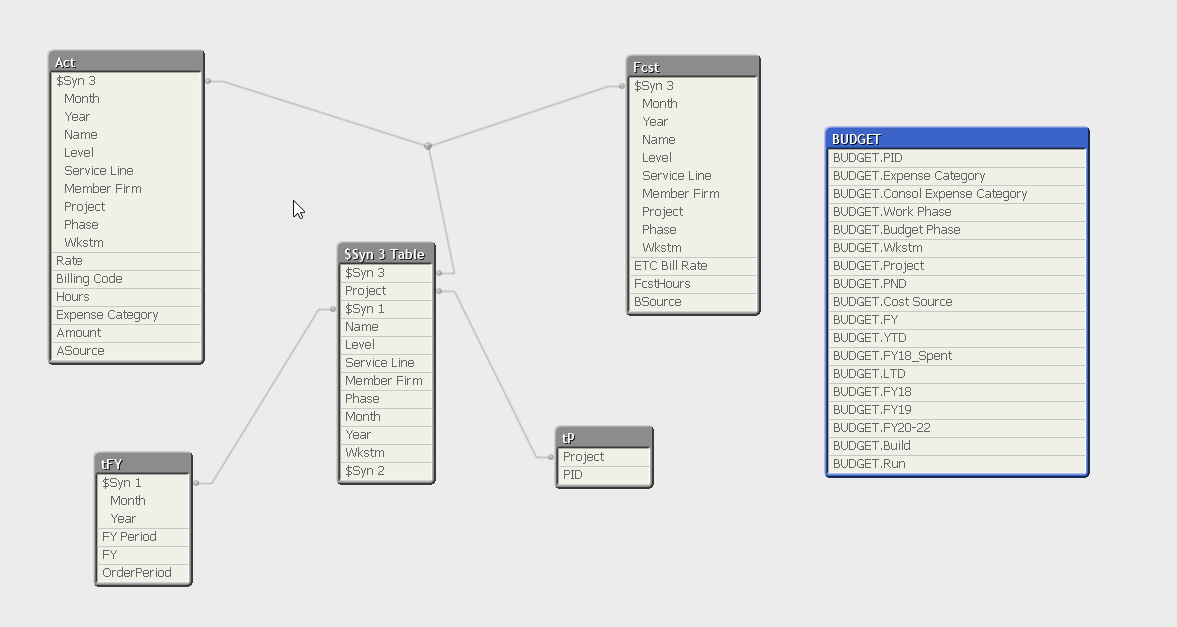
Also a view of your data model (to see the tables involved) may help.
- Mark as New
- Bookmark
- Subscribe
- Mute
- Subscribe to RSS Feed
- Permalink
- Report Inappropriate Content
Stefan,
Please find attached. Let me know if something else may be more helpful.

- Mark as New
- Bookmark
- Subscribe
- Mute
- Subscribe to RSS Feed
- Permalink
- Report Inappropriate Content
Ok, Project and Phase are part of a synthetic key and are located in two to three resident tables in your model.
I've seen some issues with large synthetic keys (and I am not sure what the run time cartesian JOIN will do in such a case).
Can't you concatenate your actual and forecast fact table to eliminate the huge syn key table?
Also, remove Month and Year from the fact table, creating a Year-Month field in the script and link this to your financial year calendar.
- Mark as New
- Bookmark
- Subscribe
- Mute
- Subscribe to RSS Feed
- Permalink
- Report Inappropriate Content
Hi Danny
You can use ApplyMap to and could avoid this kind of issue
Regards,
- « Previous Replies
-
- 1
- 2
- Next Replies »