Unlock a world of possibilities! Login now and discover the exclusive benefits awaiting you.
- Qlik Community
- :
- All Forums
- :
- QlikView App Dev
- :
- Loop-and-reduce breaks Show All Values
- Subscribe to RSS Feed
- Mark Topic as New
- Mark Topic as Read
- Float this Topic for Current User
- Bookmark
- Subscribe
- Mute
- Printer Friendly Page
- Mark as New
- Bookmark
- Subscribe
- Mute
- Subscribe to RSS Feed
- Permalink
- Report Inappropriate Content
Loop-and-reduce breaks Show All Values
I"m finding that Publisher loop-and-reduce breaks the Show All Values setting for pivot table dimensions. On reflection, this makes sense because Show All Values includes dimension values that aren't part of the currently-selected dimension. I would love some ideas for a workaround that doesn't require inserting dummy rows into the data.
The examples below show historical data for retail locations. "Show All Values" is checked for the date dimension of the column headings (the Baseline column is a dimensional value also).
1) This chart shows a location that has data rows for all date dimensions:

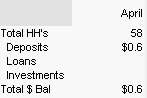
2) This chart shows current selection of a new location that only has data rows for one date dimension. "Show All Values" forces QlikView to show empty columns for the other dimension values:

3) This chart simulates Publisher loop-and-reduce by selecting the same location as 2) and then manually reducing the application to possible values:
Notice that the empty month columns disappear - they no longer exist in the data, so QlikView cannot force them to appear. This is what happens when this chart is produced in Publisher.
James
- Tags:
- loop_and_reduce