Unlock a world of possibilities! Login now and discover the exclusive benefits awaiting you.
- Qlik Community
- :
- All Forums
- :
- QlikView App Dev
- :
- MTD and YTD figures in the pivot table
- Subscribe to RSS Feed
- Mark Topic as New
- Mark Topic as Read
- Float this Topic for Current User
- Bookmark
- Subscribe
- Mute
- Printer Friendly Page
- Mark as New
- Bookmark
- Subscribe
- Mute
- Subscribe to RSS Feed
- Permalink
- Report Inappropriate Content
MTD and YTD figures in the pivot table
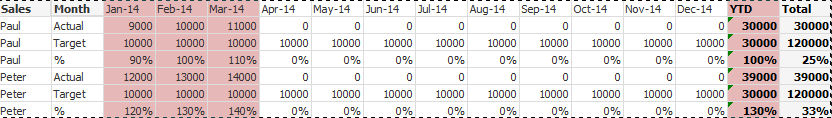
Hi everyone. I have a problem trying to add a MTD and YTD figures in a pivot table, please refer as below screen dump which what i expected, the YTD figure will be as of Mar 2014, and the Total figure will be as of Dec 2014, i have create a pivot table as attached, every things are OK except the YTD figure , I don't know how to add the YTD column in the pivot table, could you plesae help? Thanks a lot.
- Tags:
- ytd
- Mark as New
- Bookmark
- Subscribe
- Mute
- Subscribe to RSS Feed
- Permalink
- Report Inappropriate Content
HI WU Paul,
Solution is to add a total in the script.
Step 1:
create a Month field which also contains YTD as month name:
Months:
/* Create a custom month variable to add the Ytd */
load dual ( string,numrep ) as MonthName inline [
string,numrep
Jan , 1
Feb , 2
Mar , 3
Apr , 4
May , 5
Jun , 6
Jul , 7
Aug , 8
Sep , 9
Oct , 10
Nov , 11
Dec , 12
YtD , 13
];
Step 2
Add the YtD totals in the script:
Concatenate
Sales:
Load
Sales,
Date(Max(SalesDate)) as SalesDate,
Year as year2,
13 as MonthName, /* 13=YtD */
sum(Target) as Target,
sum(Amount) as Amount
resident Sales
where SalesDate < '$(vCurrentMonth)'
group by Sales,Year;
Step 3:
Because the YtD is not a real month, you to adjust your pivot so that the newly created year and MontName fields are used.
See attached solution