Unlock a world of possibilities! Login now and discover the exclusive benefits awaiting you.
- Qlik Community
- :
- All Forums
- :
- QlikView App Dev
- :
- Map issues-google map api didn't show
- Subscribe to RSS Feed
- Mark Topic as New
- Mark Topic as Read
- Float this Topic for Current User
- Bookmark
- Subscribe
- Mute
- Printer Friendly Page
- Mark as New
- Bookmark
- Subscribe
- Mute
- Subscribe to RSS Feed
- Permalink
- Report Inappropriate Content
Map issues-google map api didn't show
hello
We want to show customer sales by location in QlikView which needs to use map,but we cannot use Google map api ,what should we do?
(we are using QlikView in China,you know~)
thx
- Tags:
- map
- « Previous Replies
-
- 1
- 2
- Next Replies »
- Mark as New
- Bookmark
- Subscribe
- Mute
- Subscribe to RSS Feed
- Permalink
- Report Inappropriate Content
How do you want the map to work ? Bubbles on a map ? Polygon heat map ?
You may want to try extensions which would be free to use (and/or develop) . A common one is below. There are others.
brianwmunz/svgReader-QV11 · GitHub
GeoQlik and Analytics8 have strong licensed solution for doing sophisticated mapping as well.
- Mark as New
- Bookmark
- Subscribe
- Mute
- Subscribe to RSS Feed
- Permalink
- Report Inappropriate Content
thank you fro your reply.
But we still have problems with the 'color expression' part.
We want to make the part red when its sales<4000,show green else,how to create the expression?
thank you again~ (*^__^*)
- Mark as New
- Bookmark
- Subscribe
- Mute
- Subscribe to RSS Feed
- Permalink
- Report Inappropriate Content
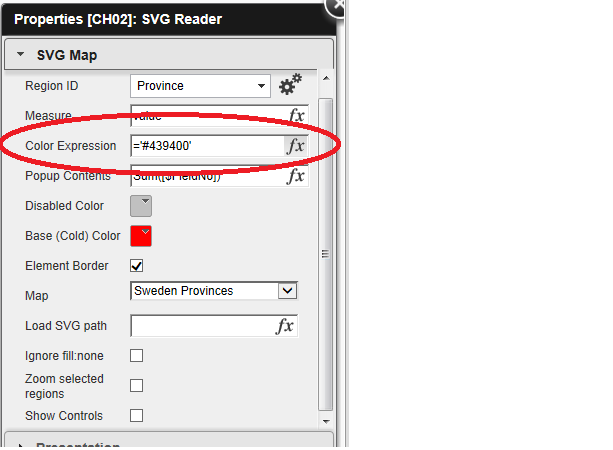
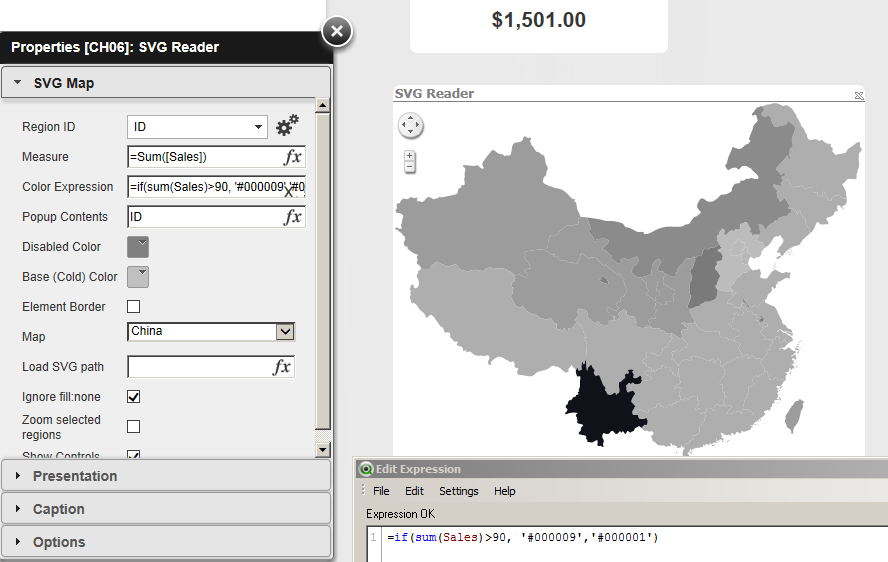
Are you referring to the SVQ Reader extension referenced above ?
If you are , there is a 'color expression' listed in the extension properties below . i'm not 100% positive, but i BELIEVE you can write a conditional color expression using qlik functions if( sum(Sales) > 4000, <green color expression> , <red color expression> )
- Mark as New
- Bookmark
- Subscribe
- Mute
- Subscribe to RSS Feed
- Permalink
- Report Inappropriate Content
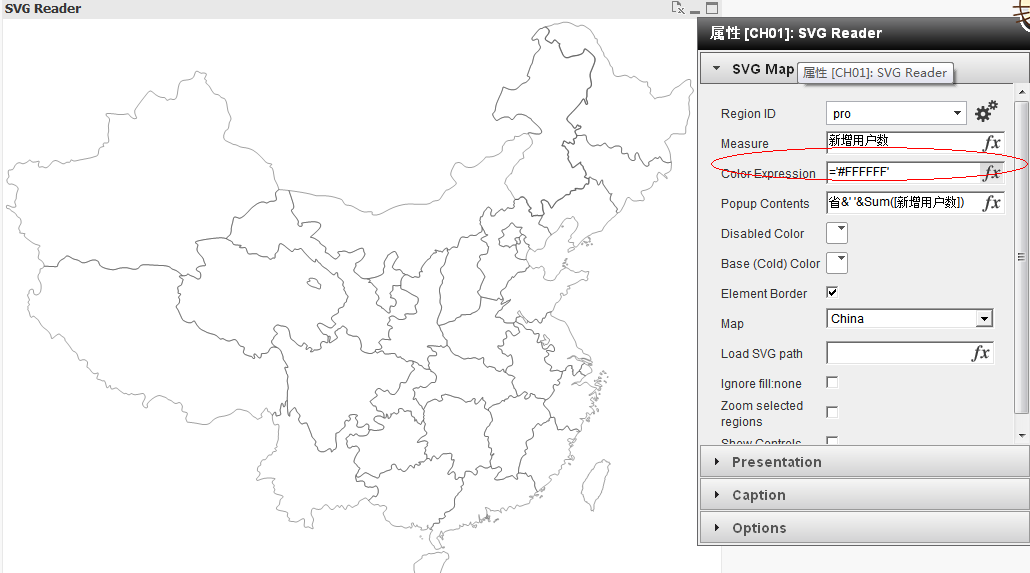
THX AGAIN~
we've tried,but it always show the white blank~
- Mark as New
- Bookmark
- Subscribe
- Mute
- Subscribe to RSS Feed
- Permalink
- Report Inappropriate Content
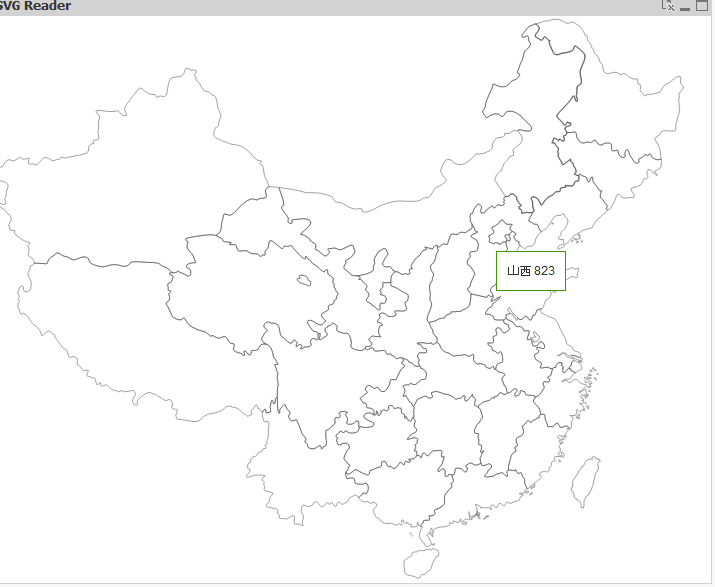
Hi - you are definitely on the right track, but when i set this up myself i had some difficulty making sure that the values in my 'Region ID' field matched up with whats in the SVG map .
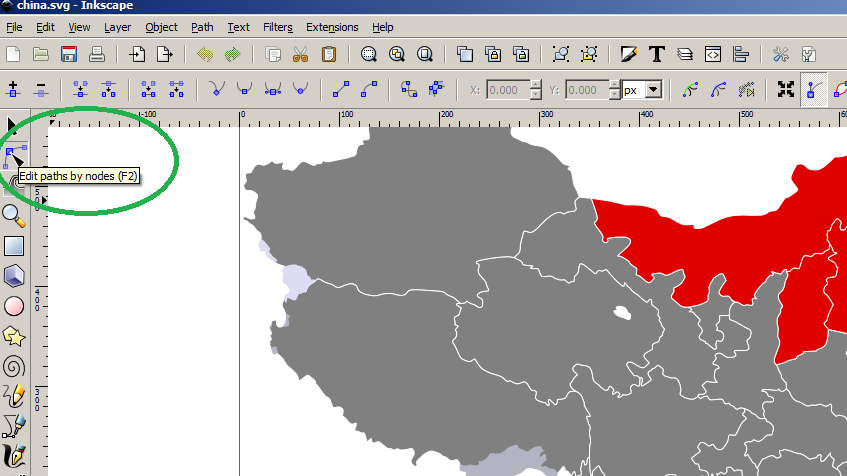
To make sure your values will work,i recommend you install the following SVG editor (it is also referenced in the github post by the extension author)
Once you install it you can open the SVG file , select 'edit paths by nodes' on the left (as you see below),
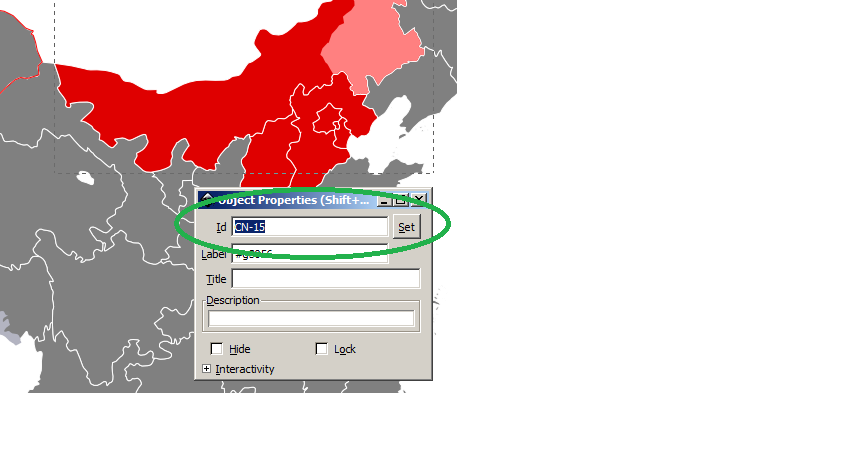
right click on an individual region and see the exact ID value. In this case its CN-15.
In QlikView, you are using the 'pro' field from your qlik data model... does it have 'CN-15' (and other values that match the SVG region IDs) as a value ?
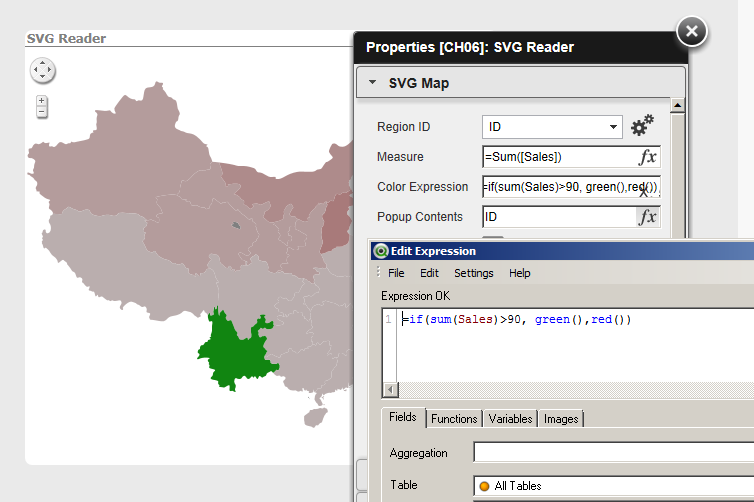
Also , try using red() or green() or another qlikview function like rgb() to define the color in the 'color extension property.
- Mark as New
- Bookmark
- Subscribe
- Mute
- Subscribe to RSS Feed
- Permalink
- Report Inappropriate Content
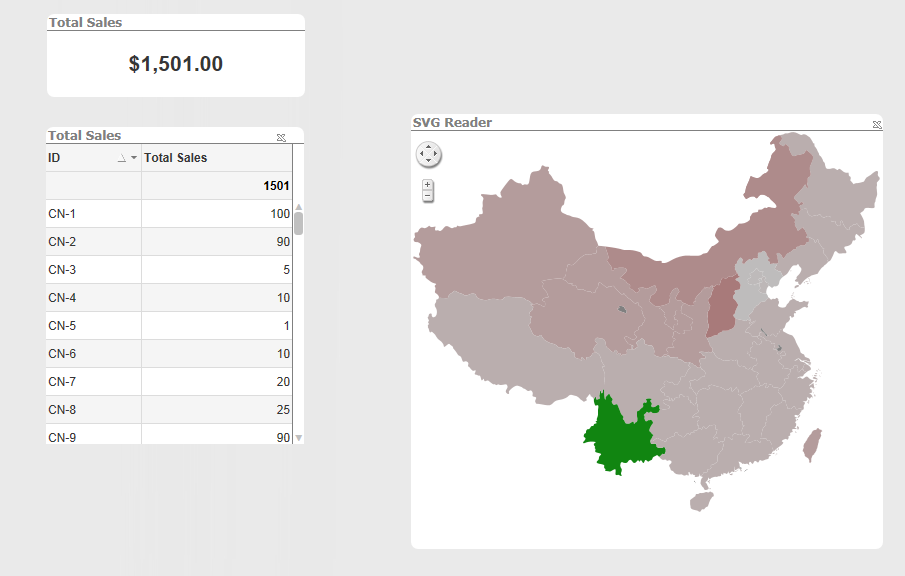
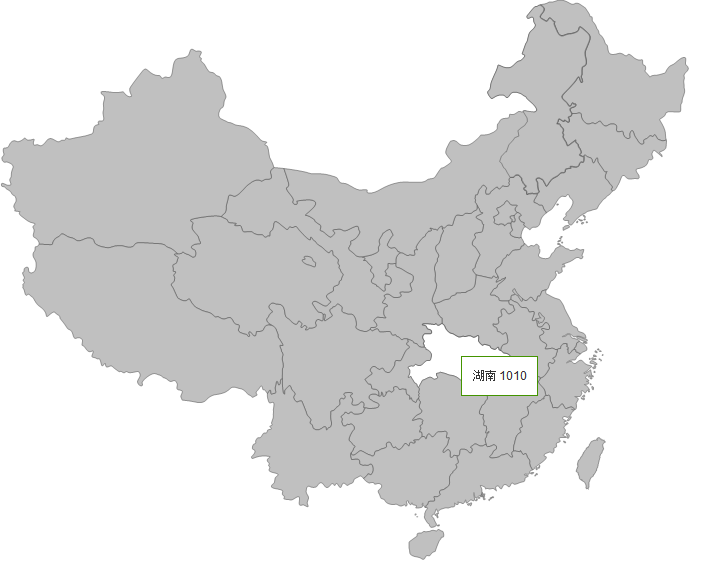
Here is an example
- Mark as New
- Bookmark
- Subscribe
- Mute
- Subscribe to RSS Feed
- Permalink
- Report Inappropriate Content
thank you
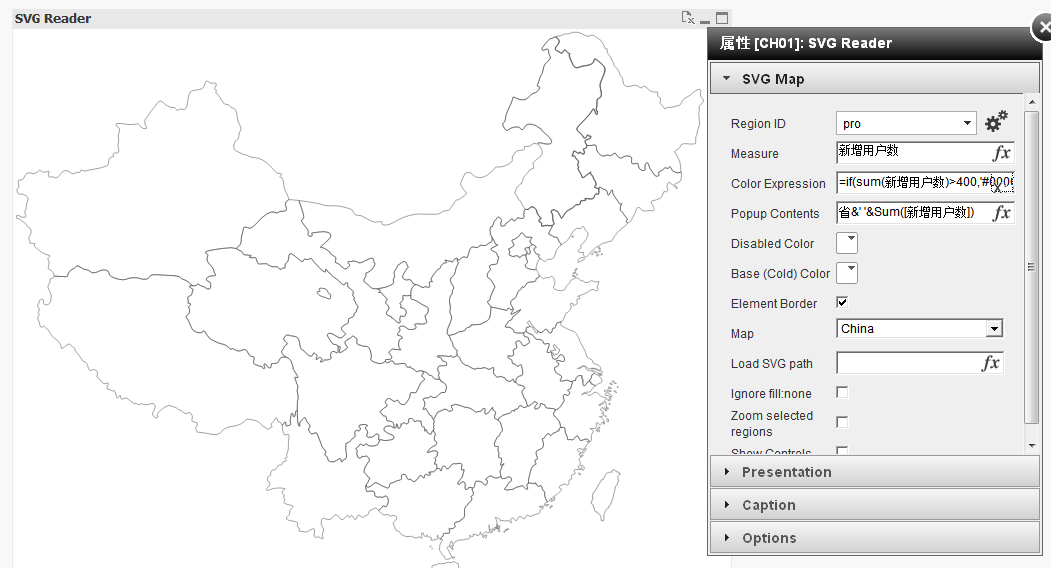
I am sure that my regionID is correct,because the value has been put on the picture.
I wonder that why my color expression didn't work.
%>_<%
- Mark as New
- Bookmark
- Subscribe
- Mute
- Subscribe to RSS Feed
- Permalink
- Report Inappropriate Content
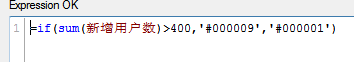
I think your expression is syntactically correct
Can you create a bar chart with the 'Pro' field as the dimension and sum(Sales) as the expression ? i would like to see what is formed.
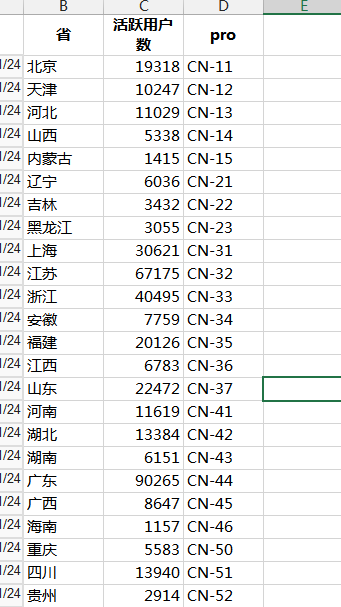
Also if you can do a screenshot of your data model showing which table 'Pro' is in and which table 'Sales' is in that would help too....
- Mark as New
- Bookmark
- Subscribe
- Mute
- Subscribe to RSS Feed
- Permalink
- Report Inappropriate Content
thank you so much for your reply
but can you show me the xlsx (data source)?
here is my screenshot
- « Previous Replies
-
- 1
- 2
- Next Replies »