Unlock a world of possibilities! Login now and discover the exclusive benefits awaiting you.
- Qlik Community
- :
- All Forums
- :
- QlikView App Dev
- :
- Max group by just one Field (not all)
- Subscribe to RSS Feed
- Mark Topic as New
- Mark Topic as Read
- Float this Topic for Current User
- Bookmark
- Subscribe
- Mute
- Printer Friendly Page
- Mark as New
- Bookmark
- Subscribe
- Mute
- Subscribe to RSS Feed
- Permalink
- Report Inappropriate Content
Max group by just one Field (not all)
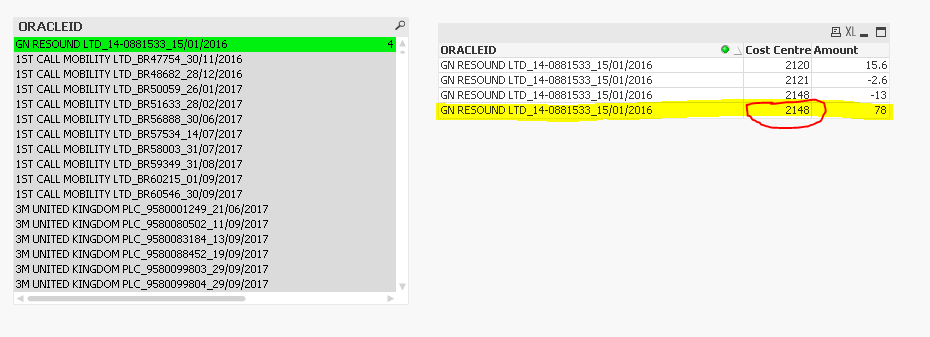
Hi all - my goal is to do a load of only unique ORACLEID keeping the Cost Centre and the Amount based on the Max Amount. As you can see I can simply do a Max(Amount) and group by ORACLEID and Cost Centre because in the below example I would end up with 3 occurrences of the same ORACLEID because there's 3 different cost centres. The aim is to just get the line highlighted, because the Amount is the highest value - what I'm really interested in is getting that Cost Centre circled. Any ideas?
PFA sample data and qvw.
Accepted Solutions
- Mark as New
- Bookmark
- Subscribe
- Mute
- Subscribe to RSS Feed
- Permalink
- Report Inappropriate Content
Try:
TESTDATA:
LOAD ORACLEID,
FirstSortedValue([Cost Centre],-Amount) as [Cost Centre],
max(Amount) as Amount
FROM
CostCodes.qvd
(qvd) Group by ORACLEID;
- Mark as New
- Bookmark
- Subscribe
- Mute
- Subscribe to RSS Feed
- Permalink
- Report Inappropriate Content
you could do this in Expression like this
max(aggr(max(Amount), ORACLEID))
Dimensions are OracleID and CostCentre

- Mark as New
- Bookmark
- Subscribe
- Mute
- Subscribe to RSS Feed
- Permalink
- Report Inappropriate Content
I need to do this in LOAD not a chart. The chart is just to verify the data.
- Mark as New
- Bookmark
- Subscribe
- Mute
- Subscribe to RSS Feed
- Permalink
- Report Inappropriate Content
Try:
TESTDATA:
LOAD ORACLEID,
FirstSortedValue([Cost Centre],-Amount) as [Cost Centre],
max(Amount) as Amount
FROM
CostCodes.qvd
(qvd) Group by ORACLEID;
- Mark as New
- Bookmark
- Subscribe
- Mute
- Subscribe to RSS Feed
- Permalink
- Report Inappropriate Content
Thanks. I'll have to do some reading up on FirstSortedValue - don't think I've used it before.