Unlock a world of possibilities! Login now and discover the exclusive benefits awaiting you.
- Qlik Community
- :
- All Forums
- :
- QlikView App Dev
- :
- Min, Max values in the line chart grid
- Subscribe to RSS Feed
- Mark Topic as New
- Mark Topic as Read
- Float this Topic for Current User
- Bookmark
- Subscribe
- Mute
- Printer Friendly Page
- Mark as New
- Bookmark
- Subscribe
- Mute
- Subscribe to RSS Feed
- Permalink
- Report Inappropriate Content
Min, Max values in the line chart grid
Hello,
I have a problem with showing Min and Max values in the expression Axes.
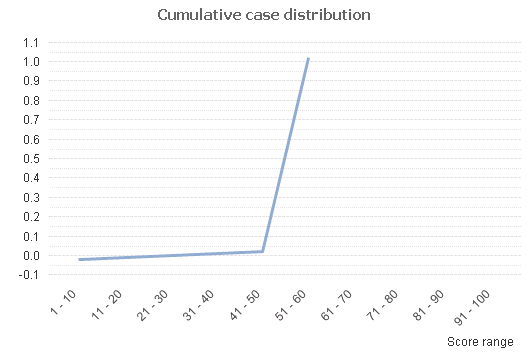
I have an inline table:
test:
load * inline
[Description, value
'1 - 10', -0.02
'11 - 20', -0.01
'21 - 30', 0
'31 - 40', 0.01
'41 - 50', 0.02
'51 - 60', 1.02]
I filled 0.1 value to the Static step.
Problem in that I need to have -0.02 and 1.02 values on the grid, but i see -0.1 and 1.1.
Is it possible?
- Mark as New
- Bookmark
- Subscribe
- Mute
- Subscribe to RSS Feed
- Permalink
- Report Inappropriate Content
Then you need to set the step size to 0.01 instead of 0.1. You can change that on the Axis tab of the properties window by setting Static Step to 0.01.
talk is cheap, supply exceeds demand
- Mark as New
- Bookmark
- Subscribe
- Mute
- Subscribe to RSS Feed
- Permalink
- Report Inappropriate Content
Hiii,
your output seems like correct . m not sure where you get wrong answer
try this one in expression
min (TOTAL <Description> value)
and for maximun
max(TOTAL <Description> value)
see the attached file
- Mark as New
- Bookmark
- Subscribe
- Mute
- Subscribe to RSS Feed
- Permalink
- Report Inappropriate Content
Hi,
Thanks for the answer, but problem is I need to have -0.02 as Min and 1.02 as Max on grid. Now I have 0.0 and 1.0