Unlock a world of possibilities! Login now and discover the exclusive benefits awaiting you.
- Qlik Community
- :
- All Forums
- :
- QlikView App Dev
- :
- Mini Chart in Limit Dimension Issue
- Subscribe to RSS Feed
- Mark Topic as New
- Mark Topic as Read
- Float this Topic for Current User
- Bookmark
- Subscribe
- Mute
- Printer Friendly Page
- Mark as New
- Bookmark
- Subscribe
- Mute
- Subscribe to RSS Feed
- Permalink
- Report Inappropriate Content
Mini Chart in Limit Dimension Issue
i have two Dimension in a Table State and City, i have put a limit Dimension on City i.e.
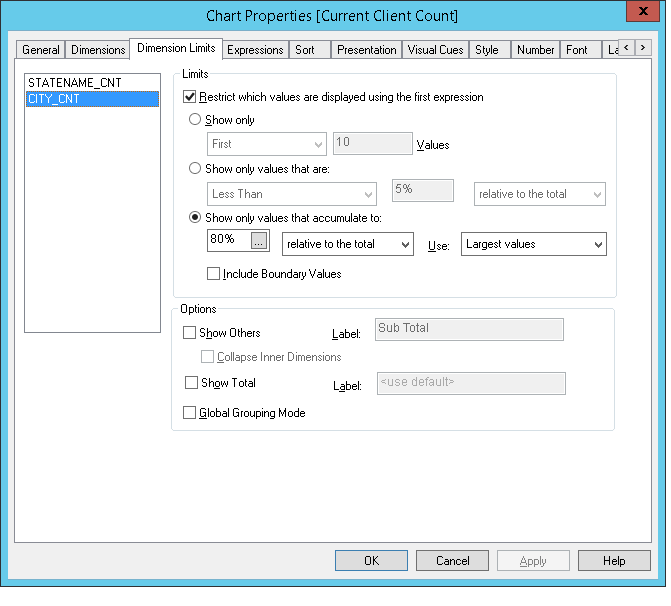
i have also created a MINI Chart in last of the table column in which i want to show the trend of the T/o.
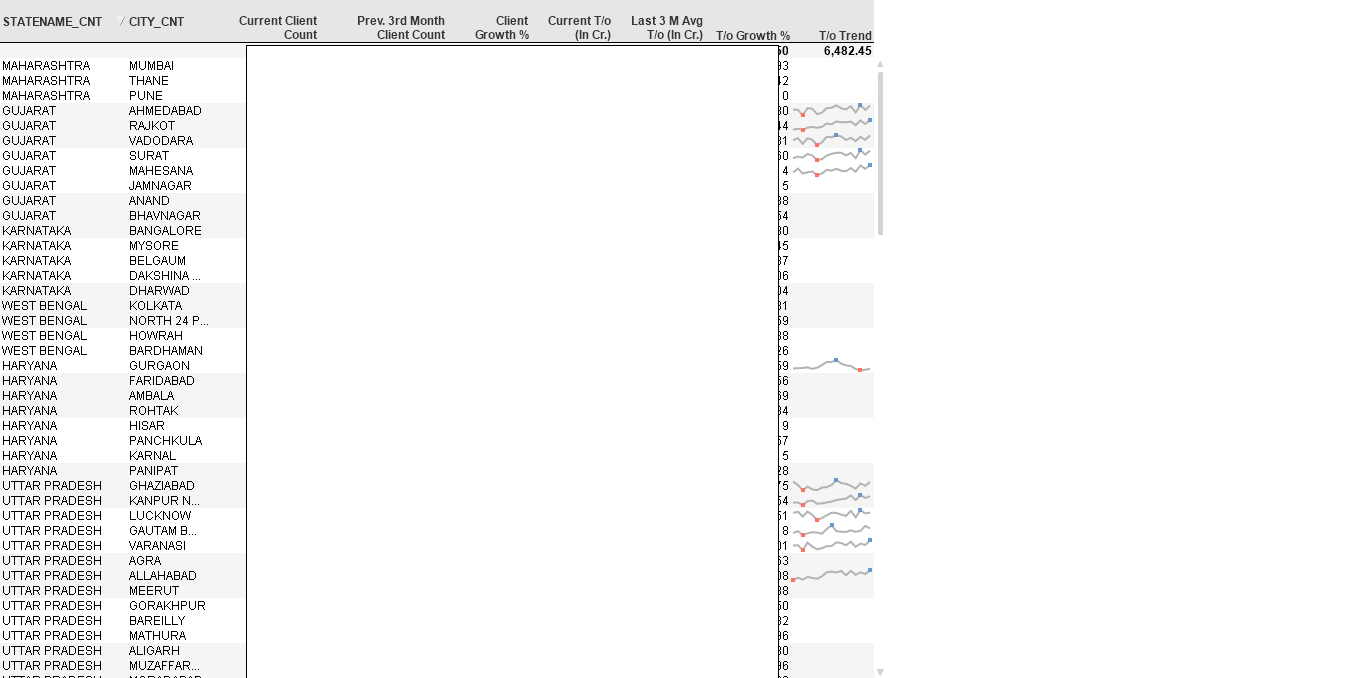
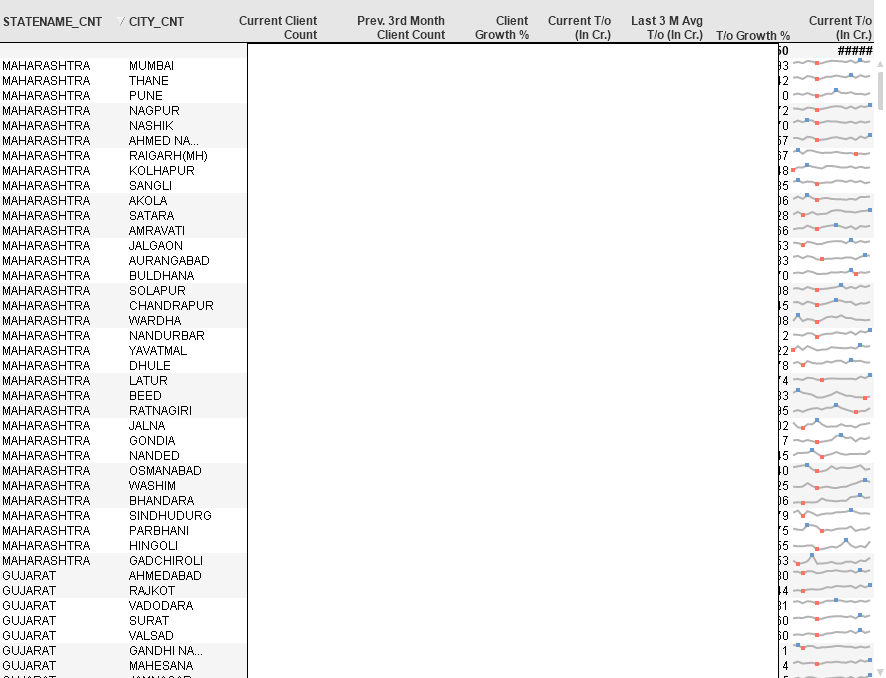
when i remove limit Dimension formula its show trend in all city. but when we put the Limit Dimension back is show me blank few City.
the Trend Dimension is MonthYear.
trend Formula:
(Sum({<MONTHYEAR=>} TRADE_VALUE)/sum({<MONTHYEAR=>} TRADING_DAYS))
- « Previous Replies
-
- 1
- 2
- Next Replies »
- Mark as New
- Bookmark
- Subscribe
- Mute
- Subscribe to RSS Feed
- Permalink
- Report Inappropriate Content
Are you sure your formula is correct?
For me it should be like this:
=(Sum({<MONTHYEAR=>} TRADE_VALUE)/count({<MONTHYEAR=>} distinct TRADING_DAYS))
- Mark as New
- Bookmark
- Subscribe
- Mute
- Subscribe to RSS Feed
- Permalink
- Report Inappropriate Content
Hi Balraj,
Formula is Correct because i have a table where i have keep MONTHYEAR, TRADING_DAYS for example.
MONTHYEAR, TRADING_DAYS
NOV-2015, 20
for Daily Avg Calculation i have to do like this only.. other place i am doing this way only..
Its a just matter of deriving value...
- Mark as New
- Bookmark
- Subscribe
- Mute
- Subscribe to RSS Feed
- Permalink
- Report Inappropriate Content
Even if i do only SUM() then also facing the problem. but when i remove the Dimension Limit its working fine.
- Mark as New
- Bookmark
- Subscribe
- Mute
- Subscribe to RSS Feed
- Permalink
- Report Inappropriate Content
okay, so what dimension limit you are trying to achieve?
- Mark as New
- Bookmark
- Subscribe
- Mute
- Subscribe to RSS Feed
- Permalink
- Report Inappropriate Content
On State & City what restriction you want to apply?
- Mark as New
- Bookmark
- Subscribe
- Mute
- Subscribe to RSS Feed
- Permalink
- Report Inappropriate Content
Already Mention the on the First Post along with the screenshot
- Mark as New
- Bookmark
- Subscribe
- Mute
- Subscribe to RSS Feed
- Permalink
- Report Inappropriate Content
did you try with suppress with null option for City Dim?
- Mark as New
- Bookmark
- Subscribe
- Mute
- Subscribe to RSS Feed
- Permalink
- Report Inappropriate Content
Hi,
Make Mode:Sparkline
click Supress when value is Null.
- Mark as New
- Bookmark
- Subscribe
- Mute
- Subscribe to RSS Feed
- Permalink
- Report Inappropriate Content
Already check that no problem with that... I think it is related to Limit Dimension only because when i remove Limit Dimension its showing mini Graph for all city.
Image After removing Limit Dimension.... Now it showing all
- « Previous Replies
-
- 1
- 2
- Next Replies »