Unlock a world of possibilities! Login now and discover the exclusive benefits awaiting you.
- Qlik Community
- :
- All Forums
- :
- QlikView App Dev
- :
- Mini Chart in Limit Dimension Issue
- Subscribe to RSS Feed
- Mark Topic as New
- Mark Topic as Read
- Float this Topic for Current User
- Bookmark
- Subscribe
- Mute
- Printer Friendly Page
- Mark as New
- Bookmark
- Subscribe
- Mute
- Subscribe to RSS Feed
- Permalink
- Report Inappropriate Content
Mini Chart in Limit Dimension Issue
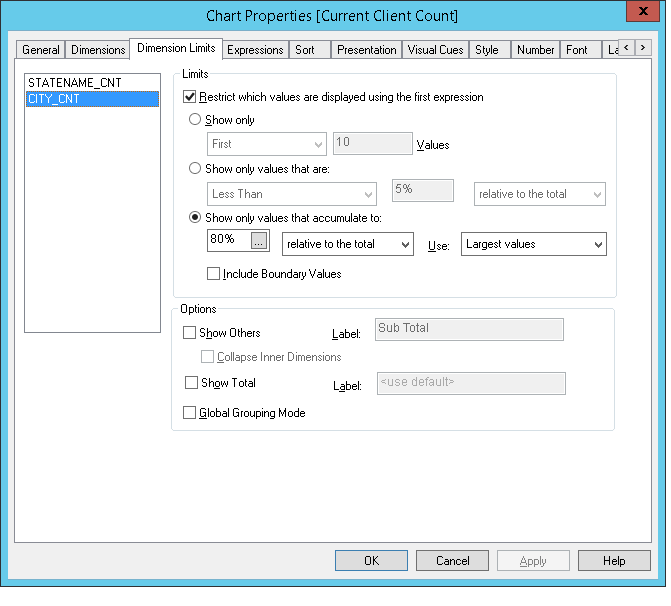
i have two Dimension in a Table State and City, i have put a limit Dimension on City i.e.
i have also created a MINI Chart in last of the table column in which i want to show the trend of the T/o.
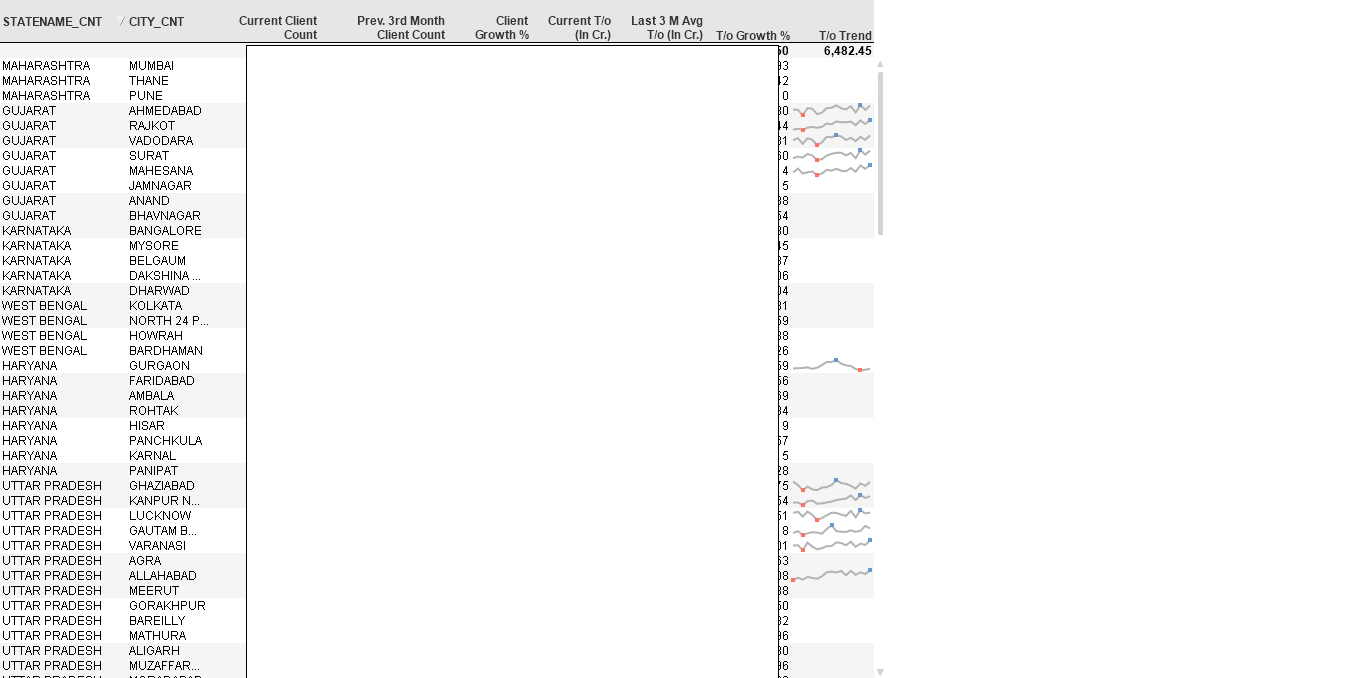
when i remove limit Dimension formula its show trend in all city. but when we put the Limit Dimension back is show me blank few City.
the Trend Dimension is MonthYear.
trend Formula:
(Sum({<MONTHYEAR=>} TRADE_VALUE)/sum({<MONTHYEAR=>} TRADING_DAYS))
- « Previous Replies
-
- 1
- 2
- Next Replies »
- Mark as New
- Bookmark
- Subscribe
- Mute
- Subscribe to RSS Feed
- Permalink
- Report Inappropriate Content
So, its very much clear that City with no value are not matching with your restriction which is like 80 % relative of the toal largest value .
.
City are not having 80 % relative of the toal largest value, will not display
- Mark as New
- Bookmark
- Subscribe
- Mute
- Subscribe to RSS Feed
- Permalink
- Report Inappropriate Content
Hi Jitendra
I'm facing exactly the same issue, did you ever get a resolution to this? If not should we raise it as a bug?
Best regards
Derek
- « Previous Replies
-
- 1
- 2
- Next Replies »