Unlock a world of possibilities! Login now and discover the exclusive benefits awaiting you.
- Qlik Community
- :
- All Forums
- :
- QlikView App Dev
- :
- Missing data labels in stacked barchart
- Subscribe to RSS Feed
- Mark Topic as New
- Mark Topic as Read
- Float this Topic for Current User
- Bookmark
- Subscribe
- Mute
- Printer Friendly Page
- Mark as New
- Bookmark
- Subscribe
- Mute
- Subscribe to RSS Feed
- Permalink
- Report Inappropriate Content
Missing data labels in stacked barchart
I have created a stacked bar chart in QlikView. Even though I enabled the data labels, when the values are small like in between 0-3, I am not able see the values unless I hover over it (see the attachment). That is fine in QlikView. But the problem is when I export them as an image in Nprinting. There is no way to know what is the value of the stacks with low value. Is there any way I can see all the data labels? Please help!!
- Mark as New
- Bookmark
- Subscribe
- Mute
- Subscribe to RSS Feed
- Permalink
- Report Inappropriate Content
there is no attachment
- Mark as New
- Bookmark
- Subscribe
- Mute
- Subscribe to RSS Feed
- Permalink
- Report Inappropriate Content
Find the picture attached here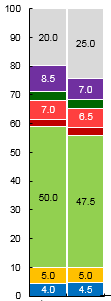
- Mark as New
- Bookmark
- Subscribe
- Mute
- Subscribe to RSS Feed
- Permalink
- Report Inappropriate Content
We don't have a way to do that , I suggest you to add the Legend in the chart so that Users can make out from the color and value but it possible only in Pie chart 
One more way would be is to crate straight table with similar dimensions and hide the dimensions and place next to the Bar chart legend so that it has the values associated with that
NOTE: you need to make sure your using the same sort order and expression in both
- Mark as New
- Bookmark
- Subscribe
- Mute
- Subscribe to RSS Feed
- Permalink
- Report Inappropriate Content
This is not practically feasible in my case. I have like 4 stacked bar charts. And in the report I have to create doesn't have space to put a table of all the values.
- Mark as New
- Bookmark
- Subscribe
- Mute
- Subscribe to RSS Feed
- Permalink
- Report Inappropriate Content
Agreed with you but we don''t other way, one more option would be to play with the Axis option in chart properties and Static Max, Static min and steps and adjust the scale but if you have higher Y axes values then the chart length needs to be increased