Unlock a world of possibilities! Login now and discover the exclusive benefits awaiting you.
- Qlik Community
- :
- All Forums
- :
- QlikView App Dev
- :
- Multiple Expressions - Line Chart - Y Axis in Perc...
Options
- Subscribe to RSS Feed
- Mark Topic as New
- Mark Topic as Read
- Float this Topic for Current User
- Bookmark
- Subscribe
- Mute
- Printer Friendly Page
Turn on suggestions
Auto-suggest helps you quickly narrow down your search results by suggesting possible matches as you type.
Showing results for
Anonymous
Not applicable
2014-11-26
11:35 AM
- Mark as New
- Bookmark
- Subscribe
- Mute
- Subscribe to RSS Feed
- Permalink
- Report Inappropriate Content
Multiple Expressions - Line Chart - Y Axis in Percent
Hello,
I have a line chart whose expressions look like this:
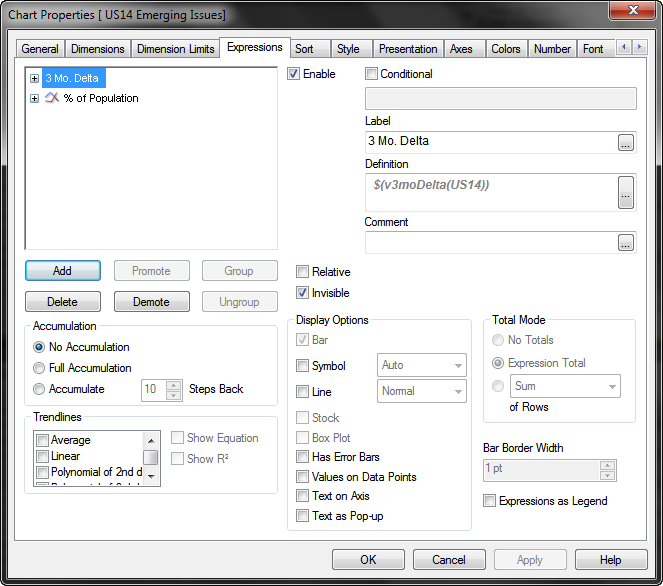
The first expression is only used in Dimension Limits so that only the 5 largest values of "3 Mo. Delta" are shown. Both expressions are a percentage and are formatted as such in the numbers tab. But the y-axis will only show as a decimal and not percentage. If I check "Text as Pop-Up" for the first expression the y-axis displays as a decimal but it screws up the color pallet to where the same color repeats twice within the 5 values on the chart. Any help would be appreciated.
Casey
272 Views
0 Replies