Unlock a world of possibilities! Login now and discover the exclusive benefits awaiting you.
- Qlik Community
- :
- All Forums
- :
- QlikView App Dev
- :
- Need help with a Contiguity Chart
- Subscribe to RSS Feed
- Mark Topic as New
- Mark Topic as Read
- Float this Topic for Current User
- Bookmark
- Subscribe
- Mute
- Printer Friendly Page
- Mark as New
- Bookmark
- Subscribe
- Mute
- Subscribe to RSS Feed
- Permalink
- Report Inappropriate Content
Need help with a Contiguity Chart
Hi,
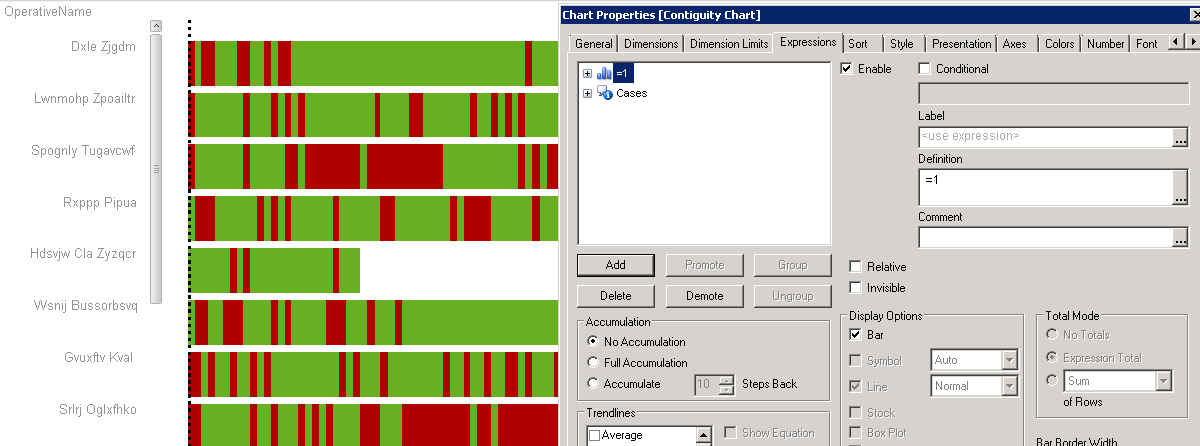
I have the following Chart. It show users activity by Minute for 1 day, some users have no activity and I want to remove these users from the chart.
I have 2 dimensions
OperativeName
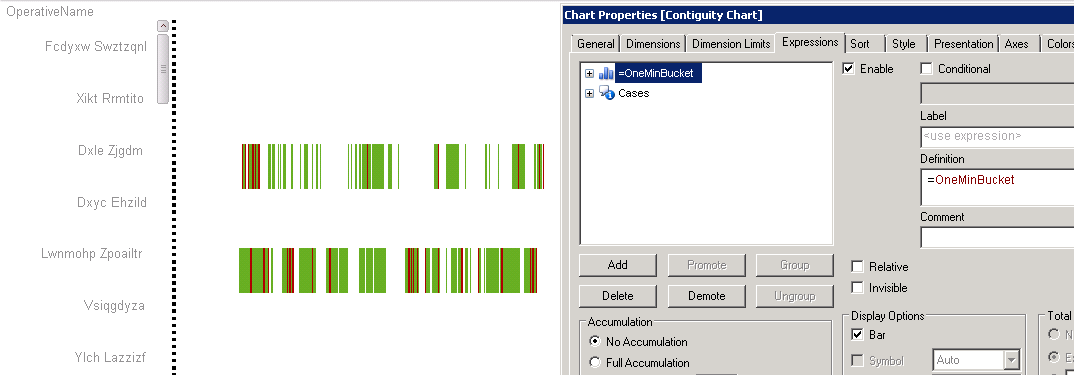
OneMinuteBucket
And the following expression
NUM(
SUM(
{<
Date = {"$(=MAX(Date))"},
[TrxType] = {'D'},
ActionID = {'PICKCASE'},
OneMinBucket = {"$(= '>=' & '07:30' & '<=' & '17:30')"}
>}
$(metric2))
,'#,##0')
- Mark as New
- Bookmark
- Subscribe
- Mute
- Subscribe to RSS Feed
- Permalink
- Report Inappropriate Content
Hi,
Tick below property
In dimension tab - > Supress when value is Null
and
in Presentation tab ->Supress zero value
Regards,
Please appreciate our Qlik community members by giving Kudos for sharing their time for your query. If your query is answered, please mark the topic as resolved 🙂
- Mark as New
- Bookmark
- Subscribe
- Mute
- Subscribe to RSS Feed
- Permalink
- Report Inappropriate Content
I tried that already, it does nothing.
- Mark as New
- Bookmark
- Subscribe
- Mute
- Subscribe to RSS Feed
- Permalink
- Report Inappropriate Content
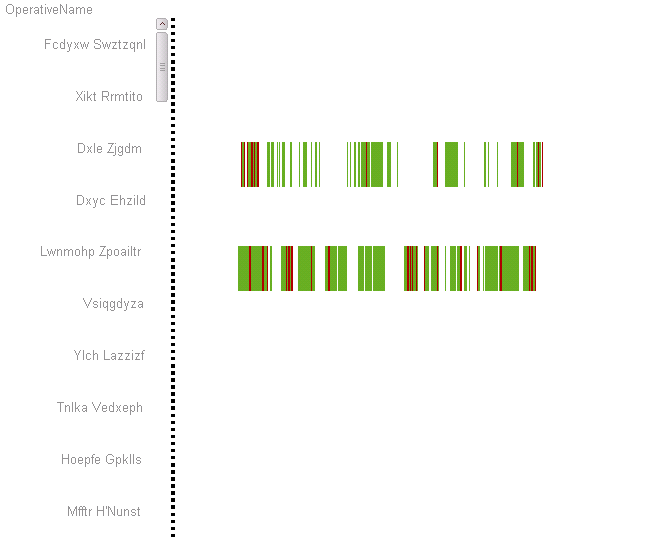
I need to show the white spaces between the green and red bars, as the white space represents inactivity.
I have the bar expression =OneMinuteBucket and I get the correct bars with the inactivity minutes in white, but for all users
If I change this to 1, I only get the users that had activity (great!), but I then lose the inactivity minutes (white space between the bars) from the chart, which is what I want to show.