Unlock a world of possibilities! Login now and discover the exclusive benefits awaiting you.
- Qlik Community
- :
- All Forums
- :
- QlikView App Dev
- :
- Need to Keep Count and Data Same what is seen for ...
- Subscribe to RSS Feed
- Mark Topic as New
- Mark Topic as Read
- Float this Topic for Current User
- Bookmark
- Subscribe
- Mute
- Printer Friendly Page
- Mark as New
- Bookmark
- Subscribe
- Mute
- Subscribe to RSS Feed
- Permalink
- Report Inappropriate Content
Need to Keep Count and Data Same what is seen for a particular category when category selection is done or not
Hi,
I've included sample data file and app.
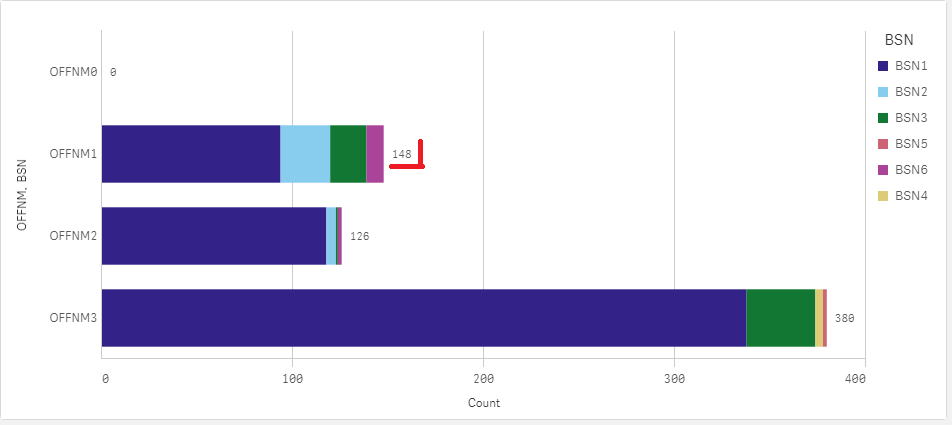
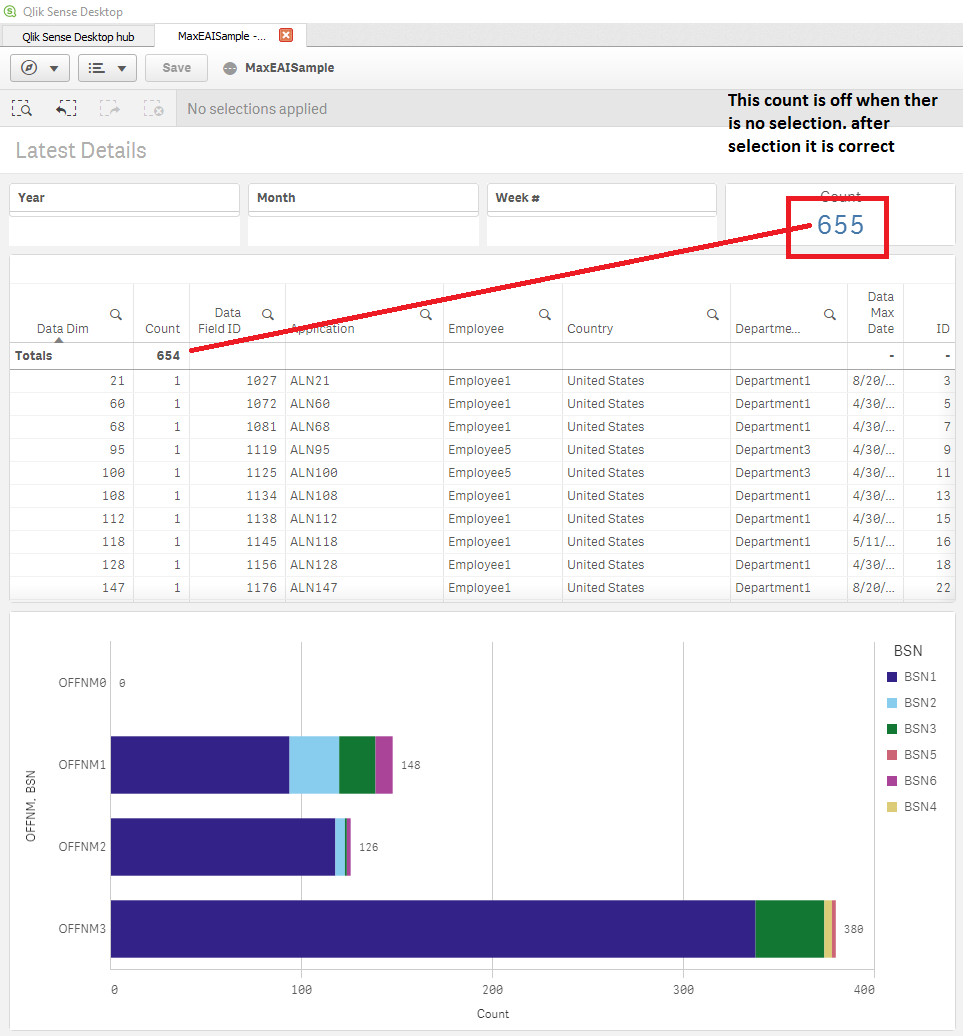
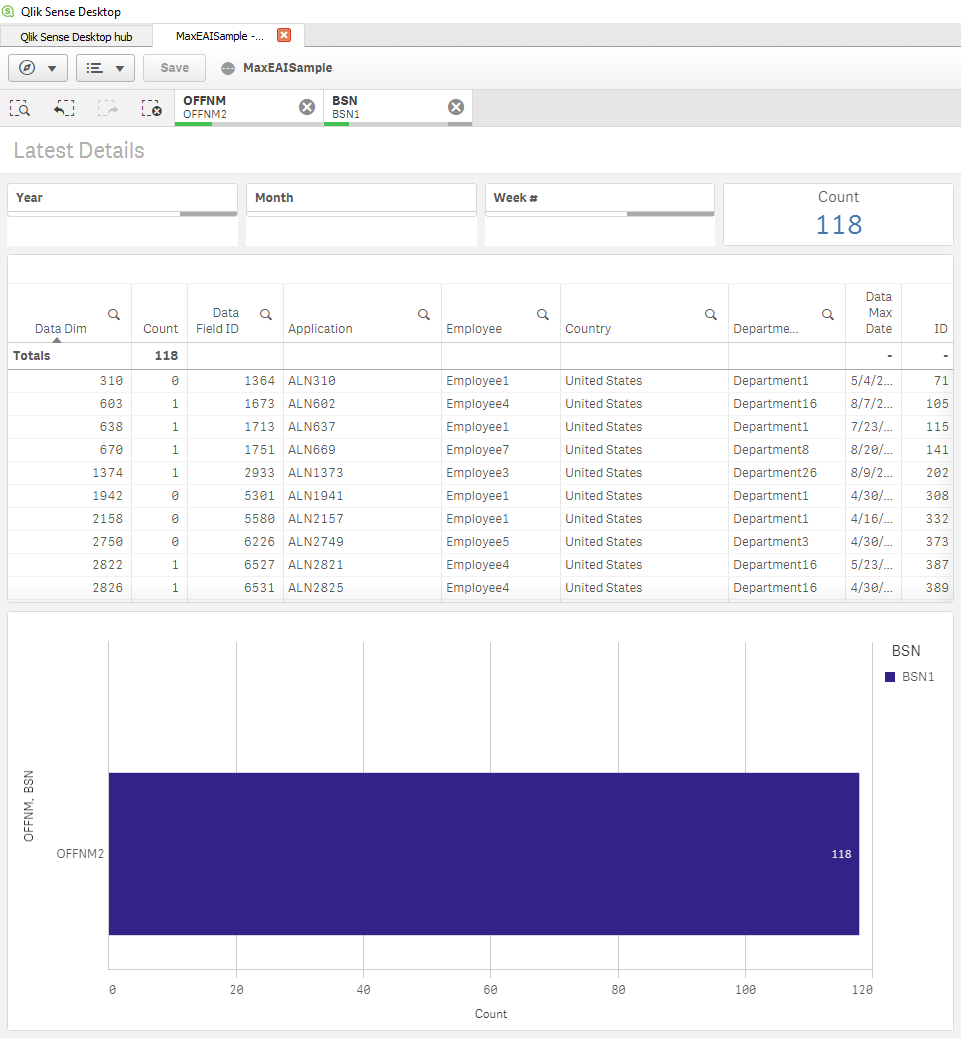
Question is about the KPI 654, Data Table, Bar Chart included in the screen shots.
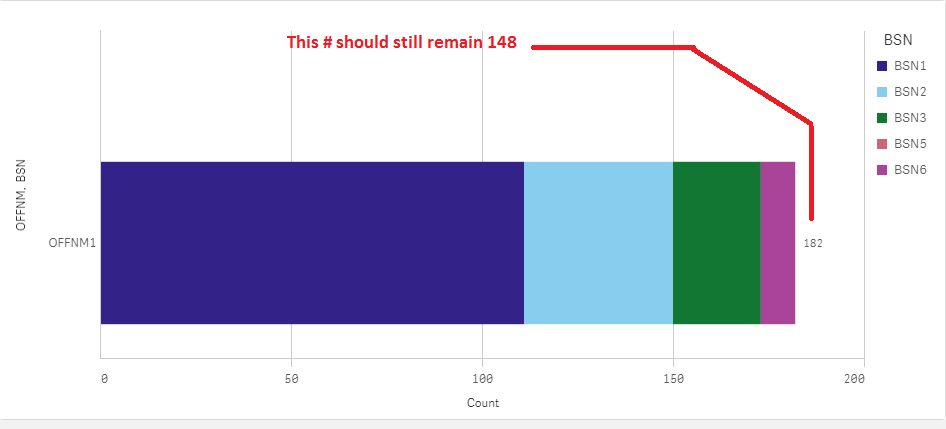
There 654 records in data table, bar chart.. In this 148 OFFNM1 records are there. Now if OFFNM1 is selected I should get same 148 count and records. Instead I'm getting 182. What changes I need to make to get same count and same records in detail, bar and KPI.
Following discussion links were related to same application.
In following calculations I've to exclude OSN value OSN1.
=Aggr(If(Max([DATE]) <= Today() - 30 and not
(
(FirstSortedValue(OFFNM, -[DATE]) = 'Basic' and FirstSortedValue(OSN, -[DATE]) >= '3')
or (FirstSortedValue(OFFNM, -[DATE]) = 'Basic Plus' and FirstSortedValue(OSN, -[DATE]) >= '5')
or (FirstSortedValue(OSN, -[DATE]) = '8')
or (FirstSortedValue(BlockerStatusName, -[DATE]) >= '2')
)
, DIM_FLD1_Id), DIM_FLD1_Id)
=Count(DISTINCT {<DIM_FLD1_Id = {"=Max([DATE]) <= Today() - 30 and not
(
(FirstSortedValue(OFFNM, -[DATE]) = 'Basic' and FirstSortedValue(OSN, -[DATE]) >= '3')
or (FirstSortedValue(OFFNM, -[DATE]) = 'Basic Plus' and FirstSortedValue(OSN, -[DATE]) >= '5')
or (FirstSortedValue(OSN, -[DATE]) = 😎
or (FirstSortedValue(BlockerStatusName, -[DATE]) >= '2')
)
"}>} DIM_FLD1_Id)
- « Previous Replies
-
- 1
- 2
- Next Replies »
Accepted Solutions
- Mark as New
- Bookmark
- Subscribe
- Mute
- Subscribe to RSS Feed
- Permalink
- Report Inappropriate Content
Hi Vinay, to simulate the calculations done in chart you need to add the chart dimensions to aggr.
That one added in the KPI is one that has BSN=Null(), and the chart is hidding null values, to avoid nulls in expression (and addind chart dimensions to aggr) it can be:
=Sum({<BSN={"*"}>} Aggr(If(Max({1} TOTAL <DIM_FLD1_Id> [Data Date]) = [Data Date], 1, 0), DIM_FLD1_Id, OFFNM, BSN, [Data Date]))
- Mark as New
- Bookmark
- Subscribe
- Mute
- Subscribe to RSS Feed
- Permalink
- Report Inappropriate Content
Vijay - I see no attachment, did you forget to add it?
- Mark as New
- Bookmark
- Subscribe
- Mute
- Subscribe to RSS Feed
- Permalink
- Report Inappropriate Content
Hi Sunny,
The browser caused some problem while attaching files and finishing up the question. I've attached them.
I'm going to include two other calculations where I've to exclude a particular value for a field. Please advise on them as well.
BR,
Vijay
- Mark as New
- Bookmark
- Subscribe
- Mute
- Subscribe to RSS Feed
- Permalink
- Report Inappropriate Content
Hi Sunny,
Any hope to get it working? The PoC will be presented to executives on Tuesday/Wednesday.
BR,
Vijay
- Mark as New
- Bookmark
- Subscribe
- Mute
- Subscribe to RSS Feed
- Permalink
- Report Inappropriate Content
Hi Vijay seems it changes because when you select a value the max date changes to the max associated date with the values selected.
This expression used in bar chart:
=Sum(Aggr(If(Max(TOTAL <DIM_FLD1_Id> [Data Date]) = [Data Date], 1, 0), DIM_FLD1_Id, [Data Date]))
To keep the referencing dsate can be converted to:
=Sum(Aggr(If(Max({1} TOTAL <DIM_FLD1_Id> [Data Date]) = [Data Date], 1, 0), DIM_FLD1_Id, [Data Date]))
- Mark as New
- Bookmark
- Subscribe
- Mute
- Subscribe to RSS Feed
- Permalink
- Report Inappropriate Content
Hi Ruben,
It does help for bar chart but KPI # and detail table still pulls higher #. I'll play around to see if I can figure it out.
BR,
Vijay
- Mark as New
- Bookmark
- Subscribe
- Mute
- Subscribe to RSS Feed
- Permalink
- Report Inappropriate Content
Hi Ruben,
I used following expression in detail table and KPI.
=Sum(Aggr(Distinct If(Max({1} TOTAL <DIM_FLD1_Id> [Data Date]) = [Data Date], 1, 0), DIM_FLD1_Id, [Data Date]))
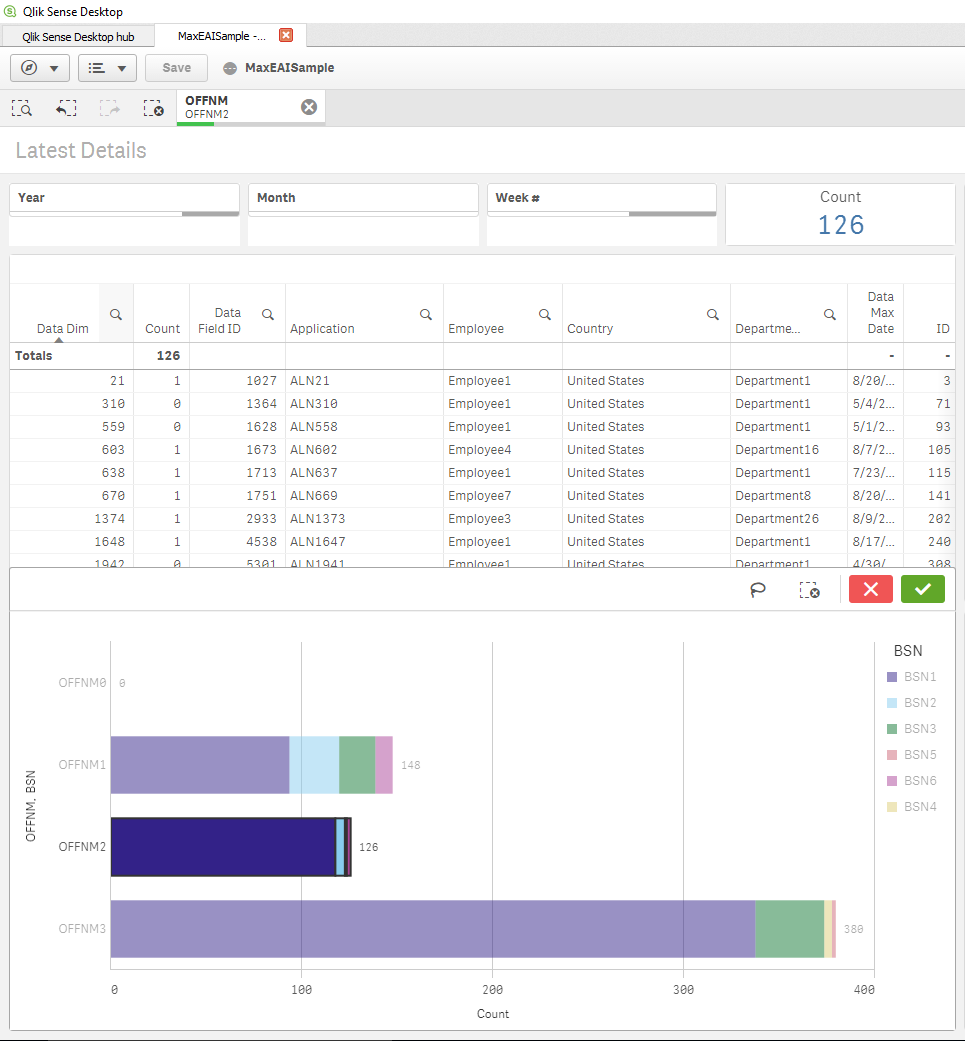
It is working for detail table. For KPI when there is no selection then it is showing wrong count, but once a selection is done it works fine. I'm including my qvf for reference.
Please take a look and advise.
BR,
Vijay
- Mark as New
- Bookmark
- Subscribe
- Mute
- Subscribe to RSS Feed
- Permalink
- Report Inappropriate Content
Hi Vinay, to simulate the calculations done in chart you need to add the chart dimensions to aggr.
That one added in the KPI is one that has BSN=Null(), and the chart is hidding null values, to avoid nulls in expression (and addind chart dimensions to aggr) it can be:
=Sum({<BSN={"*"}>} Aggr(If(Max({1} TOTAL <DIM_FLD1_Id> [Data Date]) = [Data Date], 1, 0), DIM_FLD1_Id, OFFNM, BSN, [Data Date]))
- Mark as New
- Bookmark
- Subscribe
- Mute
- Subscribe to RSS Feed
- Permalink
- Report Inappropriate Content
Hi Ruben,
It does make sense. I was thinking in same lines. The only thing I'm still trying to understand is that where is this null record coming from. As null in data set had been replaced with some values. I'll try to understand. I'm going to try using the solution in actual application. There are more charts and different aging detail table, bar chart and KPIs are there. I want to make sure all of them are behaving in sync. I'm sure they will, if not they have to be tweaked little bit and will work fine.
I'll be able to check that in a day or two, until then I'll keep this post open.
Thanks for all your help.
BR,
Vijay
- Mark as New
- Bookmark
- Subscribe
- Mute
- Subscribe to RSS Feed
- Permalink
- Report Inappropriate Content
Hi Ruben,
The Detail table shows all records but Sum expression column has 0 & 1, I need only records with 1 to show up, because those are the records belonging to that count and selection (148, OFFNM = OFFNM1)
What would be expression if I were to switch it to count function.
BR,
Vijay
- « Previous Replies
-
- 1
- 2
- Next Replies »