Unlock a world of possibilities! Login now and discover the exclusive benefits awaiting you.
- Qlik Community
- :
- All Forums
- :
- QlikView App Dev
- :
- Need to ungroup bar chart
- Subscribe to RSS Feed
- Mark Topic as New
- Mark Topic as Read
- Float this Topic for Current User
- Bookmark
- Subscribe
- Mute
- Printer Friendly Page
- Mark as New
- Bookmark
- Subscribe
- Mute
- Subscribe to RSS Feed
- Permalink
- Report Inappropriate Content
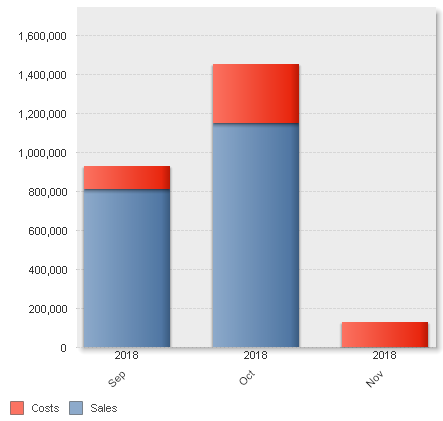
Need to ungroup bar chart
Hi all,
I need to ungroup this bar chart, however it won't let me. Any ideas? I'm using the same measure only separating Sales and Costs using set analysis.
Thanks
- Tags:
- edit charts
- Mark as New
- Bookmark
- Subscribe
- Mute
- Subscribe to RSS Feed
- Permalink
- Report Inappropriate Content
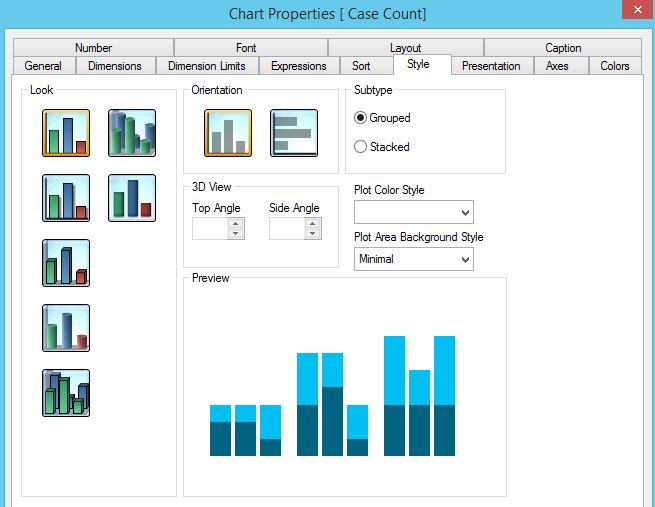
Did you try to change the style of the bar -
- Mark as New
- Bookmark
- Subscribe
- Mute
- Subscribe to RSS Feed
- Permalink
- Report Inappropriate Content
Yep
- Mark as New
- Bookmark
- Subscribe
- Mute
- Subscribe to RSS Feed
- Permalink
- Report Inappropriate Content
Just to confirm, you want separate bar for cost and Sales, right?
Can you share sample qvw?
- Mark as New
- Bookmark
- Subscribe
- Mute
- Subscribe to RSS Feed
- Permalink
- Report Inappropriate Content
Sort of hard to share QVW very large. It only has 2 expressions, Sum({<Sales_Cost = {C}>} Actual) for costs and Sum({<Sales_Cost = {S}>} Actual) for sales
- Mark as New
- Bookmark
- Subscribe
- Mute
- Subscribe to RSS Feed
- Permalink
- Report Inappropriate Content
tried to mimic your chart with some random data - Let me know if its helpful.
- Mark as New
- Bookmark
- Subscribe
- Mute
- Subscribe to RSS Feed
- Permalink
- Report Inappropriate Content
I think I may have found it. In your sample can you breakout a separate column for Year and Month, then use both of them as dimensions? Thanks.
- Mark as New
- Bookmark
- Subscribe
- Mute
- Subscribe to RSS Feed
- Permalink
- Report Inappropriate Content
I created a dimension which is YYYY_MM and deleted FISYR and MTH as dimension. Then used YYYY_MMM and it worked. Thanks for your help.