Unlock a world of possibilities! Login now and discover the exclusive benefits awaiting you.
- Qlik Community
- :
- All Forums
- :
- QlikView App Dev
- :
- Re: One formula, mathematical operation on one dim...
- Subscribe to RSS Feed
- Mark Topic as New
- Mark Topic as Read
- Float this Topic for Current User
- Bookmark
- Subscribe
- Mute
- Printer Friendly Page
- Mark as New
- Bookmark
- Subscribe
- Mute
- Subscribe to RSS Feed
- Permalink
- Report Inappropriate Content
One formula, mathematical operation on one dimensional value, then add together?
Hello community,
I am struggling with even figuring out what to use for a search string when researching this topic. Basically, I have a situation where I need to perform a multiplication against each dimensional value then add each resulting value together, finally dividing by the sum of another set of values. I am not able to see a clear path through to this but know it should work. Your guidance is greatly appreciated.
Let me illustrate...(a weighted average)...
Formula: ((P1*W1) + (P2*W2)) / (W1+W2)
Let's put some real values behind this...
| Group | Gender | Population | Weight |
|---|---|---|---|
| 1 | Male | 45 | 2 |
| 1 | Female | 23 | 1 |
| 2 | Male | 19 | 5 |
| 2 | Female | 4 | 10 |
(SUM(Population)*SUM(Weight)) / SUM(Weight)
Does not give the correct value because it will add all of the populations and add all the weights finally multiplying the two values before dividing by the weights (which would mathematically negate the multiplication anyhow).
What we need to do is:
((45*2) + (23*1) + (19*5) + (4*10)) / (2+1+5+10)
= ((90)+(23)+(95)+(40)) / (18)
= (248) / (18)
= 13.78
The total weight averages of all genders.
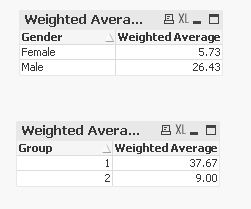
Furthermore, I then need the same formula to work if I create a chart object with the dimension Gender and the total weighted average (irrespective of Group):
Male weighted: ((45*2)+(19*5)) / (2+5) = 26.43
Female weighted: ((23*1)+(4*10)) / (1+10) = 5.73
| Gender | Weighted Average |
|---|---|
| Male | 26.43 |
| Female | 5.73 |
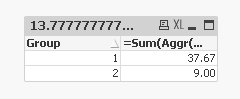
Finally, you would be able to use the same formula is showing the Group and total weighted average (irrespective of the Gender):
Group 1 weighted: ((45*2) + (23*1)) / (2+1) = 37.67
Group 2 weighted: ((19*5) + (4*10)) / (5+10) = 9.0
| Group | Weighted Average |
|---|---|
| 1 | 37.67 |
| 2 | 9.0 |
And you get the idea. One formula, any slice as long as we use the Population and the Weight in the formula.
Mike
Message was edited by: Michael Forte - Corrected a typo
- « Previous Replies
-
- 1
- 2
- Next Replies »
Accepted Solutions
- Mark as New
- Bookmark
- Subscribe
- Mute
- Subscribe to RSS Feed
- Permalink
- Report Inappropriate Content
Try this
=Sum(Aggr(Sum({<Scenario = {'Actual'}, KPI = {'Population'}>} Value) * Sum({<Scenario = {'Actual'}, KPI = {'Weight'}>} Value), Category, Group))/Sum({<Scenario = {'Actual'}, KPI = {'Weight'}>} Value)
- Mark as New
- Bookmark
- Subscribe
- Mute
- Subscribe to RSS Feed
- Permalink
- Report Inappropriate Content
try this expression
=sum(Population*Weight)/sum( Weight)
- Mark as New
- Bookmark
- Subscribe
- Mute
- Subscribe to RSS Feed
- Permalink
- Report Inappropriate Content
Check this?
- Mark as New
- Bookmark
- Subscribe
- Mute
- Subscribe to RSS Feed
- Permalink
- Report Inappropriate Content
Close, but there is a thicker plot at play here -- the data is not structured well and I am stuck with that for now...
The data set does not have just these values in it. There is a [Value] field that contains values for many different KPIs -- population and weight being just two. There is a [Scenario] field that contains an identifier for whether [Value] is plan, actual, or a comment. So, we need to apply set analysis to the equation which will "pick" the correct value.
| KPI | Category | Group | Scenario | Value |
|---|---|---|---|---|
| Population | Male | 1 | Actual | 45 |
| Population | Male | 2 | Actual | 19 |
| Population | Male | 1 | Plan | 10 |
| Population | Male | 2 | Plan | 30 |
| Population | Female | 1 | Actual | 23 |
| Population | Female | 2 | Actual | 4 |
| Population | Female | 1 | Plan | 20 |
| Population | Female | 2 | Plan | 8 |
| Weight | Male | 1 | Actual | 2 |
| Weight | Male | 2 | Actual | 5 |
| Weight | Female | 1 | Actual | 1 |
| Weight | Female | 2 | Actual | 10 |
- Mark as New
- Bookmark
- Subscribe
- Mute
- Subscribe to RSS Feed
- Permalink
- Report Inappropriate Content
Try this
=Sum(Aggr(Sum({<Scenario = {'Actual'}, KPI = {'Population'}>} Value) * Sum({<Scenario = {'Actual'}, KPI = {'Weight'}>} Value), Category, Group))/Sum({<Scenario = {'Actual'}, KPI = {'Weight'}>} Value)
- Mark as New
- Bookmark
- Subscribe
- Mute
- Subscribe to RSS Feed
- Permalink
- Report Inappropriate Content
I figured this would need an Aggr() and I just tested with it. Thanks!
- Mark as New
- Bookmark
- Subscribe
- Mute
- Subscribe to RSS Feed
- Permalink
- Report Inappropriate Content
Sunny,
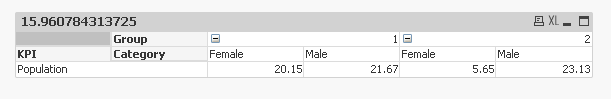
I have a new challenge and hopefully I created a data set that works for the test. Convert the table to a pivot as below, where the KPI population is weighted with a data set that has two months. I don't think we want to aggr() by month, do we?
| 1 | 2 | |||
| Male | Female | Male | Female | |
| Population | 21.67 ((45 * 2) + (10 * 4)) / (2 + 4) | 20.15 ((23 * 1) + (20 * 19)) / (1 + 19) | 23.13 ((19 * 5) + (30 * 3)) / (5 + 3) | 5.65 ((4 * 10) + (8 * 7)) / (10 + 7) |
| Month | KPI | Category | Group | Scenario | Value |
|---|---|---|---|---|---|
Jan | Population | Male | 1 | Actual | 45 |
| Jan | Population | Male | 2 | Actual | 19 |
| Feb | Population | Male | 1 | Actual | 10 |
| Feb | Population | Male | 2 | Actual | 30 |
| Jan | Population | Female | 1 | Actual | 23 |
| Jan | Population | Female | 2 | Actual | 4 |
| Feb | Population | Female | 1 | Actual | 20 |
| Feb | Population | Female | 2 | Actual | 8 |
| Jan | Weight | Male | 1 | Actual | 2 |
| Jan | Weight | Male | 2 | Actual | 5 |
| Jan | Weight | Female | 1 | Actual | 1 |
| Jan | Weight | Female | 2 | Actual | 10 |
| Feb | Weight | Male | 1 | Actual | 4 |
| Feb | Weight | Male | 2 | Actual | 3 |
| Feb | Weight | Female | 1 | Actual | 19 |
| Feb | Weight | Female | 2 | Actual | 7 |
- Mark as New
- Bookmark
- Subscribe
- Mute
- Subscribe to RSS Feed
- Permalink
- Report Inappropriate Content
This
=Sum(Aggr(Sum({<Scenario = {'Actual'}, KPI = {'Population'}>} Value) * Sum(TOTAL <Category, Group, Month>{<Scenario = {'Actual'}, KPI = {'Weight'}>} Value), KPI, Category, Group, Month))/Sum(TOTAL <Category, Group>{<Scenario = {'Actual'}, KPI = {'Weight'}>} Value)
- Mark as New
- Bookmark
- Subscribe
- Mute
- Subscribe to RSS Feed
- Permalink
- Report Inappropriate Content
Thanks Sunny. I am not able to get this to work with my data set and pivot table. Does the aggr() need to match the pivot dimensions across the top?
- Mark as New
- Bookmark
- Subscribe
- Mute
- Subscribe to RSS Feed
- Permalink
- Report Inappropriate Content
I believe so... but won't really know if you have more or less dimensions... the above might not work if you have collapsed your dimensions as well... do you need them to work even when collapsed? What would be the expected number you would expect to see when collapsed?
- « Previous Replies
-
- 1
- 2
- Next Replies »