Unlock a world of possibilities! Login now and discover the exclusive benefits awaiting you.
- Qlik Community
- :
- All Forums
- :
- QlikView App Dev
- :
- Re: Override current dimension value in chart
- Subscribe to RSS Feed
- Mark Topic as New
- Mark Topic as Read
- Float this Topic for Current User
- Bookmark
- Subscribe
- Mute
- Printer Friendly Page
- Mark as New
- Bookmark
- Subscribe
- Mute
- Subscribe to RSS Feed
- Permalink
- Report Inappropriate Content
Override current dimension value in chart
I'm trying to build a table:
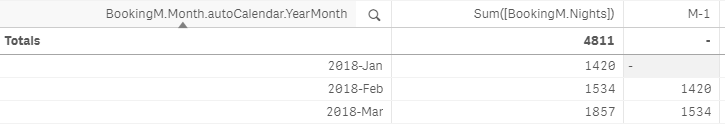
What I need is to show the actual previous month value (M-1) from the data model, not from the chart.
Using Above() is a bad idea because M-1 for "2018-Jan" shows null. My data range from 2012, so there is a value for 2017-Dec, but I can't get it.
How can I get the number of nights for 2017-Dec for the dimension 2018-Jan?
Accepted Solutions
- Mark as New
- Bookmark
- Subscribe
- Mute
- Subscribe to RSS Feed
- Permalink
- Report Inappropriate Content
Other options can be found in
Calculating rolling n-period totals, averages or other aggregations
- Mark as New
- Bookmark
- Subscribe
- Mute
- Subscribe to RSS Feed
- Permalink
- Report Inappropriate Content
For example using
- Mark as New
- Bookmark
- Subscribe
- Mute
- Subscribe to RSS Feed
- Permalink
- Report Inappropriate Content
Other options can be found in
Calculating rolling n-period totals, averages or other aggregations
- Mark as New
- Bookmark
- Subscribe
- Mute
- Subscribe to RSS Feed
- Permalink
- Report Inappropriate Content
I was wondering if it was possible to solve this problem purely in the chart formula.
Apparently, not.
I'll proceed with this solution.
Thanks.
- Mark as New
- Bookmark
- Subscribe
- Mute
- Subscribe to RSS Feed
- Permalink
- Report Inappropriate Content
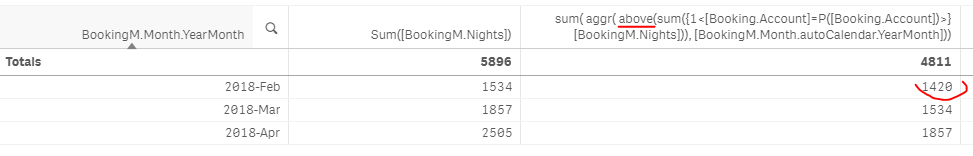
Actually, I found a solution without creating a new table thanks to the above post.
The winning formula is
sum(
  aggr(
    above(sum({1} Nights)),
    YearMonth
  )
)
"Calculate sum of nights for all the available dates, for each date get previous; intersect with the current chart context".
Brilliant.
Thanks.