Unlock a world of possibilities! Login now and discover the exclusive benefits awaiting you.
- Qlik Community
- :
- All Forums
- :
- QlikView App Dev
- :
- P() set analysis with maxstring
- Subscribe to RSS Feed
- Mark Topic as New
- Mark Topic as Read
- Float this Topic for Current User
- Bookmark
- Subscribe
- Mute
- Printer Friendly Page
- Mark as New
- Bookmark
- Subscribe
- Mute
- Subscribe to RSS Feed
- Permalink
- Report Inappropriate Content
P() set analysis with maxstring
HI All,
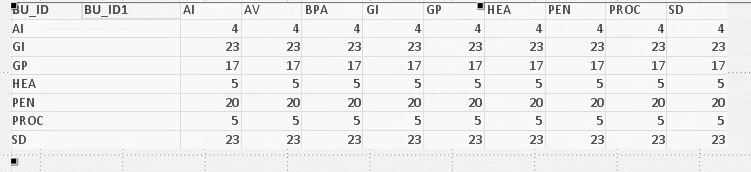
I've got a pivot table with BU_ID and BU_ID1 (unrelated but the same) as dimensions. BU_ID1 is a floating single field table. I want to show the count of %UC_ID where it exists in BU_ID but ALSO in another BU_ID.
I am using this expression:
=count( distinct {<
%UC_ID = P({<BU_ID={'$(=maxstring(BU_ID1))'}>}%UC_ID)
>} %UC_ID
the idea being that the P() element returns all possible %UC_ID's in the relevant BU_ID1
This, as you can see, doesn't work but just returns the same across all values of BU_ID1
If I replace the 'maxstring' part with a hardcoded BU eg. 'GI' then it returns what I would expect (but obviously just for that single BU)
Any ideas?
Thanks.
- Mark as New
- Bookmark
- Subscribe
- Mute
- Subscribe to RSS Feed
- Permalink
- Report Inappropriate Content
Set analysis doesn't get evaluated row-wise of the chart but once for the chart. You may try without set analysis like:
=count( distinct If(%UC_ID = BU_ID1, %UC_ID ))
- Mark as New
- Bookmark
- Subscribe
- Mute
- Subscribe to RSS Feed
- Permalink
- Report Inappropriate Content
Thanks - that makes sense. I think I'll have to split them out into expressions.