Unlock a world of possibilities! Login now and discover the exclusive benefits awaiting you.
Announcements
Live today at 11 AM ET. Get your questions about Qlik Connect answered, or just listen in.
SIGN UP NOW
- Qlik Community
- :
- All Forums
- :
- QlikView App Dev
- :
- Period Comparison on a chart using Calendar Object...
Options
- Subscribe to RSS Feed
- Mark Topic as New
- Mark Topic as Read
- Float this Topic for Current User
- Bookmark
- Subscribe
- Mute
- Printer Friendly Page
Turn on suggestions
Auto-suggest helps you quickly narrow down your search results by suggesting possible matches as you type.
Showing results for
Anonymous
Not applicable
2017-11-27
05:52 AM
- Mark as New
- Bookmark
- Subscribe
- Mute
- Subscribe to RSS Feed
- Permalink
- Report Inappropriate Content
Period Comparison on a chart using Calendar Objects
Hello All,
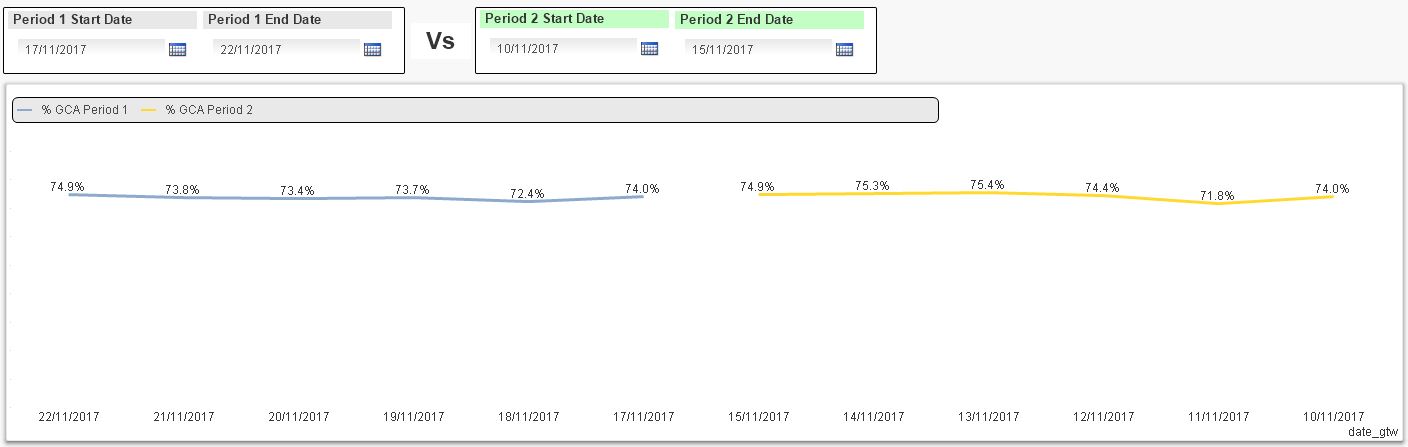
Im trying to compare the trend of a metric, on a line chart, across 2 different time periods.
The x axis will have dates and the y-axis will have the metric.
The issues that im trying to resolve are the following:
- When i select 2 date periods, with "the same" number of days, from the object calendars i would like to see 2 lines on the chart, one below the other, and not one next to the other (see image below)
- When i select 2 date periods, with "different" number of days, from the object calendars i would like to see 2 lines on the chart, one below the other, where the start dates from both date periods will be in the same vertical line (start from the same point in x axis)
This may require some VB programming code. Any help will be much appreciated.
384 Views
0 Replies