Unlock a world of possibilities! Login now and discover the exclusive benefits awaiting you.
- Qlik Community
- :
- All Forums
- :
- QlikView App Dev
- :
- Perpetual balance of last 12 months
- Subscribe to RSS Feed
- Mark Topic as New
- Mark Topic as Read
- Float this Topic for Current User
- Bookmark
- Subscribe
- Mute
- Printer Friendly Page
- Mark as New
- Bookmark
- Subscribe
- Mute
- Subscribe to RSS Feed
- Permalink
- Report Inappropriate Content
Perpetual balance of last 12 months
Hi All,
Assume I have data Years, Month, Year-Month and monthly total. I need to generate Running Balance and show in a line chart for last twelve months only dimension being Year-Month. I want to it by calculated dimension or expression and not by Load Script.
Dimension being Year-Month, say if I select 2016-Aug or nothing (max date is 2016-Aug) it shows only balance of last 12 months as bold and underlined below in line chart.
There is a lot on community about running total for items like sales but not for balances.
| Years | Month | Year-Month | Monthly Total | Running Balance |
| 2011 | Apr | 2011-Apr | 25,404.42 | 25,404.42 |
| 2011 | May | 2011-May | 40,000.00 | 65,404.42 |
| 2011 | Aug | 2011-Aug | (33,878.00) | 31,526.42 |
| 2011 | Sep | 2011-Sep | 24,828.00 | 56,354.42 |
| 2011 | Oct | 2011-Oct | 27,659.00 | 84,013.42 |
| 2011 | Nov | 2011-Nov | 622,985.00 | 706,998.42 |
| 2011 | Dec | 2011-Dec | (535,235.00) | 171,763.42 |
| 2012 | Jan | 2012-Jan | 605,478.63 | 777,242.05 |
| 2012 | Feb | 2012-Feb | (59,846.00) | 717,396.05 |
| 2012 | Mar | 2012-Mar | 852,261.00 | 1,569,657.05 |
| 2012 | Apr | 2012-Apr | (231,166.28) | 1,338,490.77 |
| 2012 | May | 2012-May | (914,644.77) | 423,846.00 |
| 2012 | Jun | 2012-Jun | 1,039,404.50 | 1,463,250.50 |
| 2012 | Jul | 2012-Jul | (516,720.00) | 946,530.50 |
| 2012 | Aug | 2012-Aug | (697,555.00) | 248,975.50 |
| 2012 | Sep | 2012-Sep | 996,473.83 | 1,245,449.33 |
| 2012 | Oct | 2012-Oct | (1,280,586.00) | (35,136.67) |
| 2012 | Nov | 2012-Nov | 176,962.23 | 141,825.56 |
| 2012 | Dec | 2012-Dec | 108,276.43 | 250,101.99 |
| 2013 | Jan | 2013-Jan | 556,708.13 | 806,810.12 |
| 2013 | Feb | 2013-Feb | (33,359.93) | 773,450.19 |
| 2013 | Mar | 2013-Mar | 2,242,339.30 | 3,015,789.49 |
| 2013 | Apr | 2013-Apr | (2,572,329.93) | 443,459.56 |
| 2013 | May | 2013-May | 641,304.16 | 1,084,763.72 |
| 2013 | Jun | 2013-Jun | (174,705.01) | 910,058.71 |
| 2013 | Jul | 2013-Jul | (586,326.93) | 323,731.78 |
| 2013 | Aug | 2013-Aug | (135,315.58) | 188,416.20 |
| 2013 | Sep | 2013-Sep | 958,848.14 | 1,147,264.34 |
| 2013 | Oct | 2013-Oct | (867,631.37) | 279,632.97 |
| 2013 | Nov | 2013-Nov | 614,080.88 | 893,713.85 |
| 2013 | Dec | 2013-Dec | 2,314,386.34 | 3,208,100.19 |
| 2014 | Jan | 2014-Jan | (2,619,150.91) | 588,949.28 |
| 2014 | Feb | 2014-Feb | (144,468.15) | 444,481.13 |
| 2014 | Mar | 2014-Mar | 503,287.58 | 947,768.71 |
| 2014 | Apr | 2014-Apr | 86,137.75 | 1,033,906.46 |
| 2014 | May | 2014-May | 463,865.87 | 1,497,772.33 |
| 2014 | Jun | 2014-Jun | 194,257.58 | 1,692,029.91 |
| 2014 | Jul | 2014-Jul | 213,899.17 | 1,905,929.08 |
| 2014 | Aug | 2014-Aug | (1,013,526.27) | 892,402.81 |
| 2014 | Sep | 2014-Sep | 1,652,219.75 | 2,544,622.56 |
| 2014 | Oct | 2014-Oct | 39,757.18 | 2,584,379.74 |
| 2014 | Nov | 2014-Nov | (1,512,779.20) | 1,071,600.54 |
| 2014 | Dec | 2014-Dec | 222,894.58 | 1,294,495.12 |
| 2015 | Jan | 2015-Jan | 420,897.14 | 1,715,392.26 |
| 2015 | Feb | 2015-Feb | (255,912.76) | 1,459,479.50 |
| 2015 | Mar | 2015-Mar | 798,877.48 | 2,258,356.98 |
| 2015 | Apr | 2015-Apr | 1,094,760.95 | 3,353,117.93 |
| 2015 | May | 2015-May | (2,047,749.50) | 1,305,368.43 |
| 2015 | Jun | 2015-Jun | (241,750.26) | 1,063,618.17 |
| 2015 | Jul | 2015-Jul | 216,308.64 | 1,279,926.81 |
| 2015 | Aug | 2015-Aug | 938,838.14 | 2,218,764.95 |
| 2015 | Sep | 2015-Sep | (97,655.82) | 2,121,109.13 |
| 2015 | Oct | 2015-Oct | (919,803.16) | 1,201,305.97 |
| 2015 | Nov | 2015-Nov | (98,464.46) | 1,102,841.51 |
| 2015 | Dec | 2015-Dec | 16,226.97 | 1,119,068.48 |
| 2016 | Jan | 2016-Jan | (471,800.01) | 647,268.47 |
| 2016 | Feb | 2016-Feb | (306,240.94) | 341,027.53 |
| 2016 | Mar | 2016-Mar | 250,778.16 | 591,805.69 |
| 2016 | Apr | 2016-Apr | 441,462.42 | 1,033,268.11 |
| 2016 | May | 2016-May | (481,035.60) | 552,232.51 |
| 2016 | Jun | 2016-Jun | 217,556.80 | 769,789.31 |
| 2016 | Jul | 2016-Jul | 240,403.90 | 1,010,193.21 |
| 2016 | Aug | 2016-Aug | (27,901.00) | 982,292.21 |
Thanks
Shoaib
- « Previous Replies
-
- 1
- 2
- Next Replies »
- Mark as New
- Bookmark
- Subscribe
- Mute
- Subscribe to RSS Feed
- Permalink
- Report Inappropriate Content
Try this:
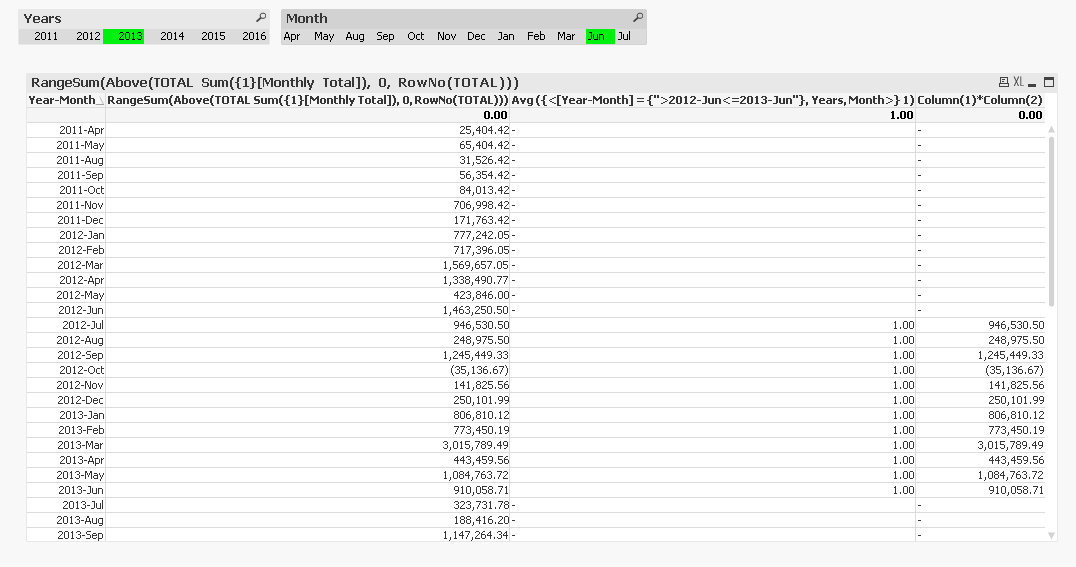
RangeSum(Above(TOTAL Sum({1}[Monthly Total]), 0, RowNo(TOTAL))) * Avg({<[Year-Month] = {"$(='>' & Date(AddMonths(Max([Year-Month]), -12), 'YYYY-MMM') & '<=' & Date(Max([Year-Month]), 'YYYY-MMM'))"}, Year, Month>} 1)
- Mark as New
- Bookmark
- Subscribe
- Mute
- Subscribe to RSS Feed
- Permalink
- Report Inappropriate Content
Thanks a ton Sunny! It's working great. But can you please explain your trick to multiply Rangesum with Avg? Rangesum is explained well in some blogs and I tried it but the real trick you did here is multiplication with Avg. I am not getting it.
RangeSum(Above(TOTAL Sum({1}[Monthly Total]), 0, RowNo(TOTAL))) * Avg ({<[Year-Month] = {"$(='>' & Date(AddMonths(Max([Year-Month]), -12), 'YYYY-MMM') & '<=' & Date(Max([Year-Month]), 'YYYY-MMM'))"}, Years, Month>} 1)
- Mark as New
- Bookmark
- Subscribe
- Mute
- Subscribe to RSS Feed
- Permalink
- Report Inappropriate Content
OK, I got your trick. Great!
- Mark as New
- Bookmark
- Subscribe
- Mute
- Subscribe to RSS Feed
- Permalink
- Report Inappropriate Content
I will take some time out later on to explain this in detail. Until then, take a leap of faith and continue using this 
- Mark as New
- Bookmark
- Subscribe
- Mute
- Subscribe to RSS Feed
- Permalink
- Report Inappropriate Content
Awesome, I am glad you tried
- « Previous Replies
-
- 1
- 2
- Next Replies »