Unlock a world of possibilities! Login now and discover the exclusive benefits awaiting you.
- Qlik Community
- :
- All Forums
- :
- QlikView App Dev
- :
- Pharma data: Intersection of P() yields unexpected...
- Subscribe to RSS Feed
- Mark Topic as New
- Mark Topic as Read
- Float this Topic for Current User
- Bookmark
- Subscribe
- Mute
- Printer Friendly Page
- Mark as New
- Bookmark
- Subscribe
- Mute
- Subscribe to RSS Feed
- Permalink
- Report Inappropriate Content
Pharma data: Intersection of P() yields unexpected results
Hello Community,
I am using an intersection of possible values in set analysis. When I use the expression in a text object, I get the correct results for any given Month/Year. When I use it in a chart, where the dimension is Month/Year, I do not get the correct results - unless I select on a single Month/Year value.
Business rules:
1. Identify physicians who wrote prescriptions (for our product) for patients who had not previously been prescribed our product ('new to brand')
2. Identify physicians who received samples of our product
3. If a physician wrote new to brand prescriptions AND the same physician received product samples,
- Sum the number of new to brand prescriptions written, then divide by
- The sum of samples received
Example: In June, Dr. Smith wrote prescriptions for 15 patients who had never been prescribed our product; also in June, Dr. Smith received 3 samples of our product: 15/3 = 5
Expression:
=sum(
{<PHYSICIAN_ID = p({<FLG_OurProduct={1}, [FLG_PatntRxNewToBrand]={1}>})
*
p({<[FLG_ReceivedSamples]={1}>}), FLG_OurProduct={1}, [FLG_PatntRxNewToBrand]={1}>}
[Rx_QTY])
/
sum(
{<PHYSICIAN_ID = p({<FLG_OurProduct={1}, [FLG_PatntRxNewToBrand]={1}>})
*
p({<[FLG_ReceivedSamples]={1}>})>}
[Samples QTY])
QV Objects
All Months
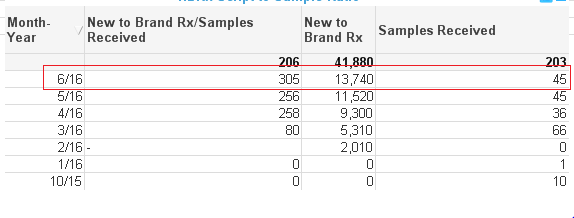
June selected

- Mark as New
- Bookmark
- Subscribe
- Mute
- Subscribe to RSS Feed
- Permalink
- Report Inappropriate Content
I think the problem is that set analysis is evaluated once per chart and you might be looking for a solution which is more like for each row. Will it be possible to share a sample to look for different options that you might have? It would also be helpful if you can provide expected output as well from the sample provided.
Best,
Sunny
- Mark as New
- Bookmark
- Subscribe
- Mute
- Subscribe to RSS Feed
- Permalink
- Report Inappropriate Content
I think Sunny is right.
There is a classic blog post that discusses
Evaluating "sets" in the context of a dimension
and also proposes one possible solution, to create an expression that pick() / match()'es the correct aggregation with set expression based on the dimension value (you would include a set modifier for the year month value in each set expression).
There are more samples in the forum that show how to do this.
You can also create a variable that builds the conditional and the sets based on the selected / possible year month values dynamically, using Concat(), but the syntax might be a bit tricky for that (but there are existing example also for this approach in the forum, AFAIR),
- Mark as New
- Bookmark
- Subscribe
- Mute
- Subscribe to RSS Feed
- Permalink
- Report Inappropriate Content
Thank you Sunny! I have attached some sample data with the desired Totals for June and July. I am refining the business rules logic:
1. Identify physicians who wrote prescriptions (for our product) for patients who had not previously been prescribed our product ('new to brand')
2. Identify physicians who received samples of our product
3. If a physician wrote new to brand prescriptions AND the same physician received product samples,
- Sum the number of new to brand prescriptions written for the current + prior 5 months; then, divide by
- The sum of samples received for the current + prior 5 months.