Unlock a world of possibilities! Login now and discover the exclusive benefits awaiting you.
- Qlik Community
- :
- All Forums
- :
- QlikView App Dev
- :
- Pivot Table Gantt Chart Collapsed Behaviour
- Subscribe to RSS Feed
- Mark Topic as New
- Mark Topic as Read
- Float this Topic for Current User
- Bookmark
- Subscribe
- Mute
- Printer Friendly Page
- Mark as New
- Bookmark
- Subscribe
- Mute
- Subscribe to RSS Feed
- Permalink
- Report Inappropriate Content
Pivot Table Gantt Chart Collapsed Behaviour
Hi
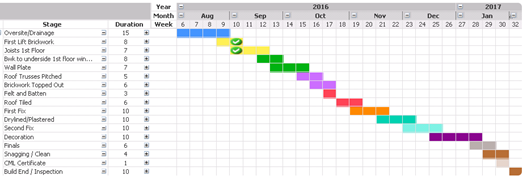
I have created a Gantt chart using a pivot table. Down the left I have build progress for a house and across the top I have my calendar year, moth and week. I have also used days on another view. I plot the colours in the pivot by using stored dates from my data and then allotting the stage description colours in the expressions background.
When the pivot table is expanded the colours are portrayed perfectly but when I collapse the pivot table I get issues where the colours overlap in week view. See examples.
EXPANDED:
COLLAPSED:

Now this is expected because my expression has an ELSE Black() at the end. I have tried so many things in order to get this to work i.e. I have created images half blue half yellow and then said if(Week = below(Week), 'image') etc. but this only works in expanded view as soon as it is collapsed the images disappear and I am left wit black again!
FYI the green ticks represent today.
Any Idea's??
Thanks
Nick
- Tags:
- qlikview pivot
- Mark as New
- Bookmark
- Subscribe
- Mute
- Subscribe to RSS Feed
- Permalink
- Report Inappropriate Content
You could try adding something into your if statement using the Dimensionality() function to tell when it is collapsed to one row. Maybe it needs different logic for one row than for the rest of it.