Unlock a world of possibilities! Login now and discover the exclusive benefits awaiting you.
- Qlik Community
- :
- All Forums
- :
- QlikView App Dev
- :
- Pivot Table Last month Sales
- Subscribe to RSS Feed
- Mark Topic as New
- Mark Topic as Read
- Float this Topic for Current User
- Bookmark
- Subscribe
- Mute
- Printer Friendly Page
- Mark as New
- Bookmark
- Subscribe
- Mute
- Subscribe to RSS Feed
- Permalink
- Report Inappropriate Content
Pivot Table Last month Sales
Hi all,
I have a pivot table with Month (field MONTH-Yr) as Dimension, and Sales as Expression.
I want to show the previous month sales as a new Expression. Also the month for January should be populated.
Note: I have YYYYMMID filed which is an integer autonumber based on field YYYYMM which I think could facilitate the problem..
Sample app is attached.
I appreciate all the help!
Thanks,
Jon
- « Previous Replies
-
- 1
- 2
- Next Replies »
Accepted Solutions
- Mark as New
- Bookmark
- Subscribe
- Mute
- Subscribe to RSS Feed
- Permalink
- Report Inappropriate Content
I will break this expression to help you understand the expression.... This is actually the easiest it can get....
Part 1A -> Above(Sum({<CalendarYear>}Sales))
Part 1B -> Above(Sum(Sales))
The difference between Part1A and Part1B is that Part1A excludes any selection in CalendarYear. Why I think of adding that? Because you had a selection in Year field. If you plan to make selection in YYYYMMID, then I would say add that to your set analysis to so that we can ignore any selection in that.

In the image above I see Jan-2016 value for Part1A because I have ignore selection in CalendarYear whereas I don't see in Part 1B. Now because we have ignore selection in CalendarYear, we will start to see all CalendarYear. To combat this problem, we introduce multiplication with Avg(1). Avg(1) will equal to 1 within selection and will equal 0 outside of selection
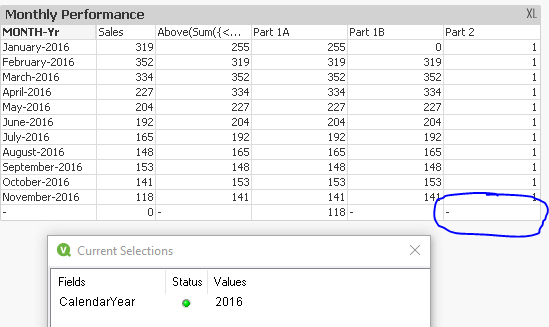
Now I multiple the two and bang I get what I needed.
Does it make sense?
Best,
Sunny
- Mark as New
- Bookmark
- Subscribe
- Mute
- Subscribe to RSS Feed
- Permalink
- Report Inappropriate Content
Try this:
Above(Sum({<CalendarYear>}Sales)) * Avg(1)
- Mark as New
- Bookmark
- Subscribe
- Mute
- Subscribe to RSS Feed
- Permalink
- Report Inappropriate Content
Thanks Sunny, Seems to give the correct result, but can you explain the expression? I find it hard to get why such a simple and common requirement ends up in quite a complex expression 🙂 Do you know how to utilize field YYYYMMID to solve this kind of problem as that would make it more readable? I tried something on the following lines: =sum({< YYYYMMID={$(=YYYYMMID -1)} >} Sales) but didn't manage to get it to work. Thanks, Jon
- Mark as New
- Bookmark
- Subscribe
- Mute
- Subscribe to RSS Feed
- Permalink
- Report Inappropriate Content
I will break this expression to help you understand the expression.... This is actually the easiest it can get....
Part 1A -> Above(Sum({<CalendarYear>}Sales))
Part 1B -> Above(Sum(Sales))
The difference between Part1A and Part1B is that Part1A excludes any selection in CalendarYear. Why I think of adding that? Because you had a selection in Year field. If you plan to make selection in YYYYMMID, then I would say add that to your set analysis to so that we can ignore any selection in that.
In the image above I see Jan-2016 value for Part1A because I have ignore selection in CalendarYear whereas I don't see in Part 1B. Now because we have ignore selection in CalendarYear, we will start to see all CalendarYear. To combat this problem, we introduce multiplication with Avg(1). Avg(1) will equal to 1 within selection and will equal 0 outside of selection
Now I multiple the two and bang I get what I needed.
Does it make sense?
Best,
Sunny
- Mark as New
- Bookmark
- Subscribe
- Mute
- Subscribe to RSS Feed
- Permalink
- Report Inappropriate Content
Thanks Sunny I appreciate your help and the time to provide the explanation. It is straightforward but never knew of such techniques to use Avg(1). Just wanted to reconfirm that there is no way of using YYYYMMID as in sum({< YYYYMMID={$(=YYYYMMID -1)} >} Sales) in pivot tables, snice it should work fine in other types of charts correct? Good day, Jon
- Mark as New
- Bookmark
- Subscribe
- Mute
- Subscribe to RSS Feed
- Permalink
- Report Inappropriate Content
Since you are dimension is a time dimension, the set analysis won't work because set analysis is evaluated once per chart. So, basically YYYYMMID-1 will have to output only one value and that will happen only when you have selected one MonthYear or you can use Max(YYYYMMID) - 1 but then you will see only a single previous month in your chart and that is not what you want. So in this case the only way to get this work is to use Above function.
Since it should work fine in other types of charts correct? Good day, Jon
What other charts do you imagine this would work in? in it's current form, it will only work if you have one YYYYMMID selected. and what if you have selected a particular YYYYMMID (say 158), it will show you the sum for 157.
- Mark as New
- Bookmark
- Subscribe
- Mute
- Subscribe to RSS Feed
- Permalink
- Report Inappropriate Content
Yes you're right charts wont work when using that kind of logic.
Thanks for your help, will mark your answer as Correct 
- Mark as New
- Bookmark
- Subscribe
- Mute
- Subscribe to RSS Feed
- Permalink
- Report Inappropriate Content
Can this be done over multiple Years with a Month-Year dimension and say a State dimension? Also is there an expression like this that can work in a Table to be used in a ClimberCustomReport?
- Mark as New
- Bookmark
- Subscribe
- Mute
- Subscribe to RSS Feed
- Permalink
- Report Inappropriate Content
Can this be done over multiple Years with a Month-Year dimension and say a State dimension?
It can... will need modification if you need full accumulation vs accumulation for each state
Also is there an expression like this that can work in a Table to be used in a ClimberCustomReport?
Not sure what ClimberCustomReport is
- Mark as New
- Bookmark
- Subscribe
- Mute
- Subscribe to RSS Feed
- Permalink
- Report Inappropriate Content
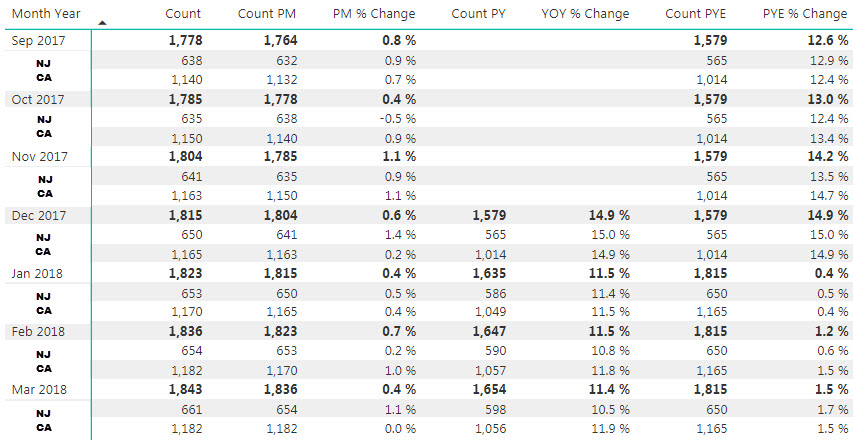
I'm looking for accumulation for each state, or other dimensions. Ideally I would want the ability to bring in multiple dimensions and have the measure still work. If you had a custom pivot with the ability to bring in State, County, City and Zip - Or any combination of them.
ClimberCustomReport is a Qlik Sense extension that makes building a custom report simple. The report works like an Excel pivot table by being able to choose dimensions and measures. This extension works by using a regular table with all possible fields. So can an expression calculate like below with the ability to bring in State, County City or Zip to see "Sales" by any dimension?
This type of view-
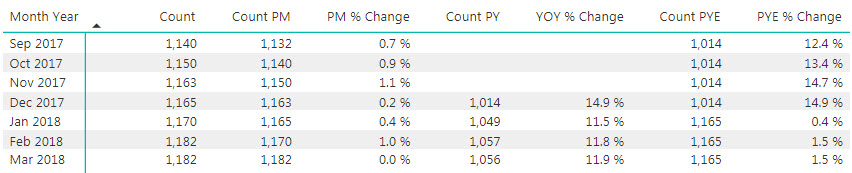
Then bring in State, County, City or Zip
- « Previous Replies
-
- 1
- 2
- Next Replies »