Unlock a world of possibilities! Login now and discover the exclusive benefits awaiting you.
- Qlik Community
- :
- All Forums
- :
- QlikView App Dev
- :
- Pivot Table: Sum in Rows but fabs (absolut values...
- Subscribe to RSS Feed
- Mark Topic as New
- Mark Topic as Read
- Float this Topic for Current User
- Bookmark
- Subscribe
- Mute
- Printer Friendly Page
- Mark as New
- Bookmark
- Subscribe
- Mute
- Subscribe to RSS Feed
- Permalink
- Report Inappropriate Content
Pivot Table: Sum in Rows but fabs (absolut values) in the columns all
Hallo,
I do have a pivot Table in QlikView like this (i just faked it in Excel for data privacy & for an easier understanding):
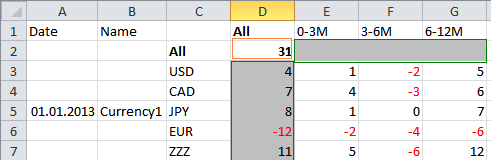
=> This should be the final result!
With one Fact (Expression) “CurrencyValue” and the Dimensions (Date, Name, Currency and Timeline (0-3m, 3-6M and 6-12m))
Now here is what I would like to have:
In the Red rectangle section:
The sum() of all Elements from the timeline regarding the Currency.
In the green rectangle section:
Just nulls. No Sum at all.
In the orange rectangle section:
Here it comes. The added absolute values (sum(fabs())) from all grey Elements in column D except the Currency ‘ZZZ’.
The last one is kind of tricky because I would like to have the sum() of the values of D.
Here is what I got so far:
(in the Expression Tab of the Pivot Table under Definition for the fact “CurrencyValue”)
if(Dimensionality() = 3, Sum(CurrencyValue),
if(SecondaryDimensionality() = 1, null(), sum(fabs(CurrencyValue) - if(Currency = 'ZZZ', fabs(CurrencyValue), 0)))
)
The problem is that I get following table:
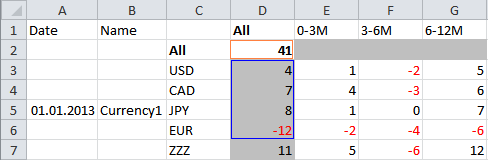
=> I got so far.
The problem lies in the orange rectangle section. I just get sum(fabs()) from all values not just the values from the blue box.
Does anybody know how to solve this issue to get the a pivot table like the first above?
Any help is appreciated,
Markus