Unlock a world of possibilities! Login now and discover the exclusive benefits awaiting you.
- Qlik Community
- :
- All Forums
- :
- QlikView App Dev
- :
- Re: Pivot grouping
- Subscribe to RSS Feed
- Mark Topic as New
- Mark Topic as Read
- Float this Topic for Current User
- Bookmark
- Subscribe
- Mute
- Printer Friendly Page
- Mark as New
- Bookmark
- Subscribe
- Mute
- Subscribe to RSS Feed
- Permalink
- Report Inappropriate Content
Pivot grouping
Dear Experts,
I have the simple file below loaded :
tmp:
LOAD
Group, --consists of group 1, group 2, group 3
Month, --consists of JAN, FEB, MAR
count(Customers)
FROM [lib://Data Source/somefile.csv]
(txt, utf8, embedded labels, delimiter is ',', msq) ;
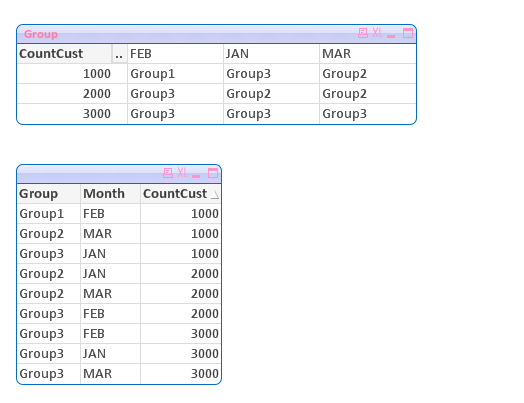
My expected output is as such in a pivot table :
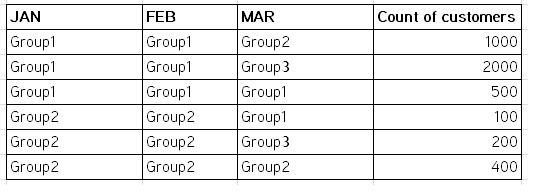
It shows the count of customers that changes group over the months, been trying for days to achieve this. No luck yet
Please help 🙂
Thanks
Ram
Malaysia
- Mark as New
- Bookmark
- Subscribe
- Mute
- Subscribe to RSS Feed
- Permalink
- Report Inappropriate Content
Hi Ramanan,
Please attached your source file.
Regards,
Mahesh.
- Mark as New
- Bookmark
- Subscribe
- Mute
- Subscribe to RSS Feed
- Permalink
- Report Inappropriate Content
Hi Ramanan:
Use this expression.
=MaxString(Aggr(Only(Group),CountCust,Month))
- Mark as New
- Bookmark
- Subscribe
- Mute
- Subscribe to RSS Feed
- Permalink
- Report Inappropriate Content
Manuel,
Is there any chance to share that qvw for reference
- Mark as New
- Bookmark
- Subscribe
- Mute
- Subscribe to RSS Feed
- Permalink
- Report Inappropriate Content
Yes, there you have.
Thanks!!
- Mark as New
- Bookmark
- Subscribe
- Mute
- Subscribe to RSS Feed
- Permalink
- Report Inappropriate Content
Great share Manuel, Thanks
But am afraid that I missed out an important detail in my previous explanations, the data is actually granular down to the individual customerID rather than a count of customers, with this granular level table, how do we achieve the mentioned pivot table? Kindly help
tmp:
LOAD
Group, --consists of group 1, group 2, group 3
Month, --consists of JAN, FEB, MAR
count(CustomerID)
FROM [lib://Data Source/somefile.csv]
(txt, utf8, embedded labels, delimiter is ',', msq) ;
