Unlock a world of possibilities! Login now and discover the exclusive benefits awaiting you.
- Qlik Community
- :
- All Forums
- :
- QlikView App Dev
- :
- Pivot table calculation of weighted average of per...
- Subscribe to RSS Feed
- Mark Topic as New
- Mark Topic as Read
- Float this Topic for Current User
- Bookmark
- Subscribe
- Mute
- Printer Friendly Page
- Mark as New
- Bookmark
- Subscribe
- Mute
- Subscribe to RSS Feed
- Permalink
- Report Inappropriate Content
Pivot table calculation of weighted average of percentage % with aggregation of subtotals - how to?
Hi,
Am going in circles attempting to do a volume weighted average of an % value in a pivot table in QV 12.1.
(this % cannot be calculated from other data in the db, it is manually entered by a user, so the record in the db is a % value)
I provide a simplified QVD and some test data in associated QVD. Path to the QVD will need to be updated for anyone else to load it though. Also in the QVD I have locked it to showing only one awoId record to simply the view.
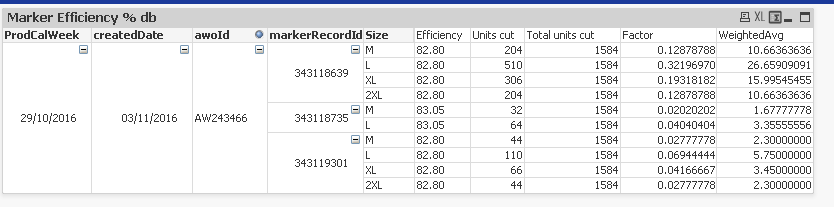
Below is a screencap of the attached Excel doc which shows the weighted average calculation I'm hoping to achieve, 82.815% for this particular awoId.
![2016-11-24 20_44_17-WAefficiency.xls [Compatibility Mode] - Excel.png](/legacyfs/online/144788_2016-11-24 20_44_17-WAefficiency.xls [Compatibility Mode] - Excel.png)
Data in the pivot is aggregated by dimensions of ProdCalWeek, createdDate, awoId and markerRecordId and Size.
Each awoId contains multiple markerRecordIds.
A "Marker Efficiency %" value exists for each markerRecordId.
I wish to weight this "Marker Efficiency %" by "Units cut" / "Total Units cut" so as to weight the efficiency more strongly when its proportion of units of the total is greater, and vice versa.
Taking the first row as an example this means 82.8 * (102/1584)
then I would Sum all the rows under Weighted Average Effic% to get to a Weighted Average % for the awoId
I have tried many ways in both the script and in the chart but am not getting a working result.
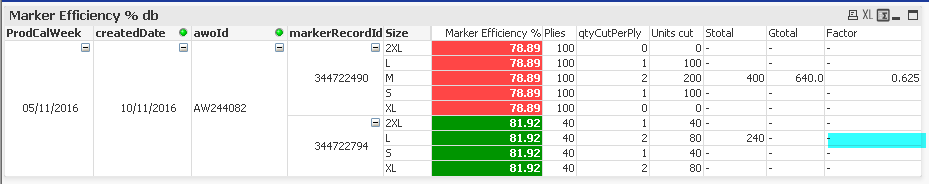
The attached QVD shows me this at present:
![2016-11-24 20_35_42-QlikView x64 - [Q__40 MODELS_MarkerEfficiencySimple.qvw_].png](/legacyfs/online/144789_2016-11-24 20_35_42-QlikView x64 - [Q__40 MODELS_MarkerEfficiencySimple.qvw_].png)
In the loaded data:
"Units cut" = quantityCutPerPly * plies
"Factor" = "Efficiency" * "Units cut"/"Total units cut"
If I then could Sum all the factors for each awoId I would get to the weighted average % for that awoId
so to get the weighted average for each awoId I'm expecting to do something like the following:
Aggr(Sum (markerEfficiency * quantityCutPerPly*plies / Sum(quantityCutPerPly*plies),awoId)
I would like to have a Weighted average % display for each markerRecordId when the pivot table is expanded, then when closed 1 level down to show the Weighted average % for each awoId, then when closed to the createdDate level to show the Weighted average % for each createdDate, and finally to show the Weighted average % for each ProdCalWeek.
Please can someone suggest a solution. Thanks
- « Previous Replies
-
- 1
- 2
- Next Replies »
Accepted Solutions
- Mark as New
- Bookmark
- Subscribe
- Mute
- Subscribe to RSS Feed
- Permalink
- Report Inappropriate Content
How about this:
Sum(Aggr((markerEfficiency * quantityCutPerPly*plies)/((Sum(TOTAL <awoId> quantityCutPerPly*plies)/Count(Size))), ProdCalWeek, createdDate, awoId, markerRecordId, Size))/Count(DISTINCT awoId)
- Mark as New
- Bookmark
- Subscribe
- Mute
- Subscribe to RSS Feed
- Permalink
- Report Inappropriate Content
After a bit more head bashing this week I've figured out the syntax for partial and total aggregations that work for the above, but not yet how I combine the two to obtain a weighting factor so would appreciate some help on that front.
Stotal =
Aggr(Sum(quantityCutPerPly*plies),markerRecordId,awoId,createdDate,ProdCalWeek)
gives me a partial sum per markerRecordId
and
Gtotal =
Aggr(Sum(quantityCutPerPly*plies),awoId,createdDate,ProdCalWeek)
gives me a partial sum per awoId
Now I want to display the result of Stotal / Gtotal partial sum per markerRecordId
I have tried ...
Factor =
Aggr(Sum(quantityCutPerPly*plies),markerRecordId,awoId) / Aggr(Sum(quantityCutPerPly*plies),awoId)
only displays a result in the first markerRecordId but not the lower markerRecordId
0.625 = 400/640 is correct but I want to see the result of 240 / 640 = 0.375 displayed in the turq blue box as well
How can I achieve this?
Thanks
- Mark as New
- Bookmark
- Subscribe
- Mute
- Subscribe to RSS Feed
- Permalink
- Report Inappropriate Content
This
WeightedAvg Expression
(markerEfficiency * quantityCutPerPly*plies)/((Sum(TOTAL <awoId> quantityCutPerPly*plies)/Count(Size)))
- Mark as New
- Bookmark
- Subscribe
- Mute
- Subscribe to RSS Feed
- Permalink
- Report Inappropriate Content
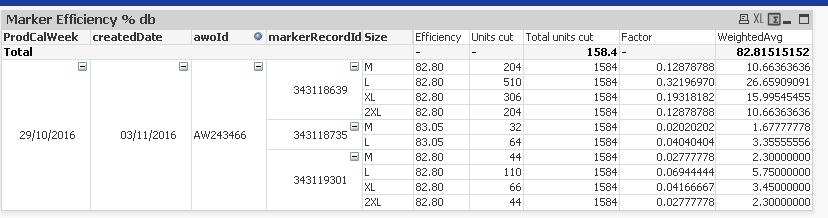
and this if you want to get the total right also
Sum(Aggr((markerEfficiency * quantityCutPerPly*plies)/((Sum(TOTAL <awoId> quantityCutPerPly*plies)/Count(Size))), ProdCalWeek, createdDate, awoId, markerRecordId, Size))
- Mark as New
- Bookmark
- Subscribe
- Mute
- Subscribe to RSS Feed
- Permalink
- Report Inappropriate Content
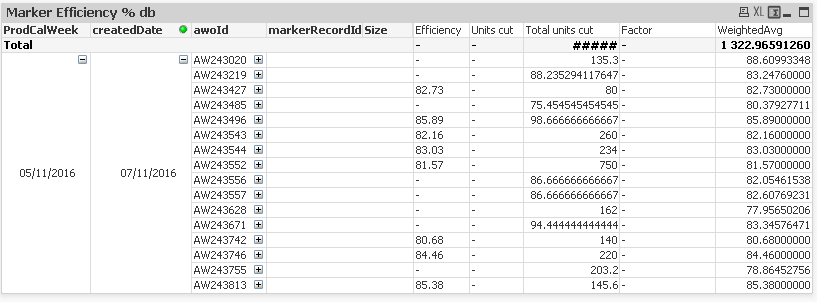
Hi Sunny,
Superb! Thank you very much :-)). This is very close to what I'm looking to achieve. At the higher aggregation levels - i.e. createdDate and ProdCalWeek I'm getting a WeightedAvg value display which is larger than I'm expecting it to be - the value should always be a % < 100. I will take your suggested solution and see if I can figure the rest of it now and post again I get there or if there's still a final hurdle. Thanks again for getting me on track so quickly.
- Mark as New
- Bookmark
- Subscribe
- Mute
- Subscribe to RSS Feed
- Permalink
- Report Inappropriate Content
At a higher level (createdDate) the value is getting added up for individual awoId. What would you want to see instead of the sum at this level? Average?
- Mark as New
- Bookmark
- Subscribe
- Mute
- Subscribe to RSS Feed
- Permalink
- Report Inappropriate Content
Hi Sunny,
Busy pondering that same thing right now, and thinking that weighting further up the pivot levels would just muddy the waters, so yes a simple average at the createdDate and ProdCalWeek levels would be perfect, thank you.
- Mark as New
- Bookmark
- Subscribe
- Mute
- Subscribe to RSS Feed
- Permalink
- Report Inappropriate Content
How about something like this:
Avg(Aggr((markerEfficiency * quantityCutPerPly*plies)/((Sum(TOTAL <awoId> quantityCutPerPly*plies)/Count(Size))), ProdCalWeek, createdDate, awoId, markerRecordId, Size))
- Mark as New
- Bookmark
- Subscribe
- Mute
- Subscribe to RSS Feed
- Permalink
- Report Inappropriate Content
Actually that did not work.... Working on it now 
- Mark as New
- Bookmark
- Subscribe
- Mute
- Subscribe to RSS Feed
- Permalink
- Report Inappropriate Content
Yes I did try that and hit the same wall 😞
My current guess to fix that is thinking maybe I could use the Dimensionality() chart function, along the lines of If(Dimensionality()<3, "calc" and then add a further IF level for the sum by awoId so that I can do different calcs for different pivot table levels ...
- « Previous Replies
-
- 1
- 2
- Next Replies »