Unlock a world of possibilities! Login now and discover the exclusive benefits awaiting you.
- Qlik Community
- :
- All Forums
- :
- QlikView App Dev
- :
- Re: Pivot table chart "show partial sums" total cu...
- Subscribe to RSS Feed
- Mark Topic as New
- Mark Topic as Read
- Float this Topic for Current User
- Bookmark
- Subscribe
- Mute
- Printer Friendly Page
- Mark as New
- Bookmark
- Subscribe
- Mute
- Subscribe to RSS Feed
- Permalink
- Report Inappropriate Content
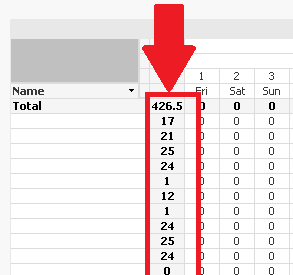
Pivot table chart "show partial sums" total custom visual background
In a pivot table chart, when you tick show partial sums you get a summed column that has a grey background (for the light theme) is there a way to customise this:
Accepted Solutions
- Mark as New
- Bookmark
- Subscribe
- Mute
- Subscribe to RSS Feed
- Permalink
- Report Inappropriate Content
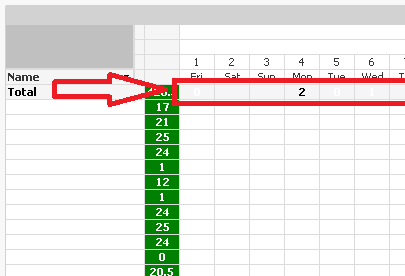
Click on the + in front of the expression on the Expression tab, select background color and enter an expression in the Definition field like =if(SecondaryDimensionality()=1, lightblue()). Depending on the number of dimensions you may have to use another value then 1. Experiment to see what works for your pivot table.
talk is cheap, supply exceeds demand
- Mark as New
- Bookmark
- Subscribe
- Mute
- Subscribe to RSS Feed
- Permalink
- Report Inappropriate Content
excellent!
What about the top row..
- Mark as New
- Bookmark
- Subscribe
- Mute
- Subscribe to RSS Feed
- Permalink
- Report Inappropriate Content
You might also be able to play around with this using Custom Format Cell
Custom formatting table cells - The Qlik Fix! The Qlik Fix!
https://help.qlik.com/en-US/qlikview/12.0/Subsystems/Client/Content/Custom_Format_Cell_dialog.htm
- Mark as New
- Bookmark
- Subscribe
- Mute
- Subscribe to RSS Feed
- Permalink
- Report Inappropriate Content