Unlock a world of possibilities! Login now and discover the exclusive benefits awaiting you.
- Qlik Community
- :
- All Forums
- :
- QlikView App Dev
- :
- Re: Pivot table - filter in expression
- Subscribe to RSS Feed
- Mark Topic as New
- Mark Topic as Read
- Float this Topic for Current User
- Bookmark
- Subscribe
- Mute
- Printer Friendly Page
- Mark as New
- Bookmark
- Subscribe
- Mute
- Subscribe to RSS Feed
- Permalink
- Report Inappropriate Content
Pivot table - filter in expression
Hi All,
I have questions Q1 to Q33. i need to display only Q1 to Q13 in a pivot table.
Script, dimensions and expressions used are as below
Script
Table:
Crosstable(Questions, Value,4)
SQL Select MYSTERY_SHOPPER, DEALER, COUNTRY, WAVE, Q1, Q2, Q3, Q4, Q5,Q6,Q7A,Q7B,Q8,Q9,Q10,Q11,Q12,Q13,
Q14,Q15A,Q15B,Q15C,Q15D,Q15F,Q15G,Q15H,Q15I,Q16,Q17,Q18,Q19,Q20,Q21,
Q22,Q23,Q24,Q25,Q26,Q27,Q28,Q29,Q30,Q31,Q32_A ,Q32_B,Q32_C,Q32_D Q33
From Table1
Dimension
1. =if (Match(Questions,'Q1','Q2','Q3','Q4','Q5','Q6','Q7A','Q7B','Q8','Q9','Q10','Q11','Q12','Q13'),Questions)
2. MYSTERY_SHOPPER
Expression
if ( SecondaryDimensionality()=1 ,
if ( sum(Alt(Value,0)) = 1 , Dual('Yes',1) , if ( sum(Alt(Value,0)) = 0 , Dual('No',0) , sum(Alt(Value,0))))
, num(sum ({<Questions={'Q1','Q2','Q3','Q4','Q5','Q6','Q7A','Q7B','Q8','Q9','Q10','Q11','Q12','Q13'}>}Alt(Value,0))/
count ({<Questions={'Q1','Q2','Q3','Q4','Q5','Q6','Q7A','Q7B','Q8','Q9','Q10','Q11','Q12','Q13'}>} Value ),'0%' ))
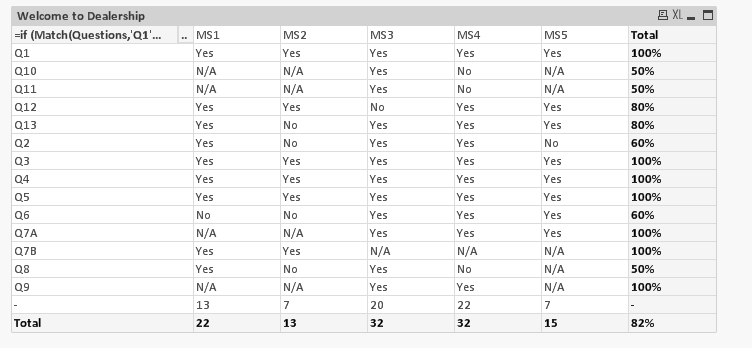
Based on the filter in expression i am supposed to get Q1 to Q13. i don't know why i am getting the the row before total.
Please help to avoid the row before total.
Thanks,
Selva
Accepted Solutions
- Mark as New
- Bookmark
- Subscribe
- Mute
- Subscribe to RSS Feed
- Permalink
- Report Inappropriate Content
This:
Dimension
1. =if (Match(Questions,'Q1','Q2','Q3','Q4','Q5','Q6','Q7A','Q7B','Q8','Q9','Q10','Q11','Q12','Q13'),Questions)
returns Q1 - Q13 for Questions which are in the match
and null() for Queststions that aren't
These null-values are shown in the last line.
Suspress null values in the dimension tab.
- Mark as New
- Bookmark
- Subscribe
- Mute
- Subscribe to RSS Feed
- Permalink
- Report Inappropriate Content
Thanks a lot MartinPohl