Unlock a world of possibilities! Login now and discover the exclusive benefits awaiting you.
- Qlik Community
- :
- All Forums
- :
- QlikView App Dev
- :
- Pivot table help
- Subscribe to RSS Feed
- Mark Topic as New
- Mark Topic as Read
- Float this Topic for Current User
- Bookmark
- Subscribe
- Mute
- Printer Friendly Page
- Mark as New
- Bookmark
- Subscribe
- Mute
- Subscribe to RSS Feed
- Permalink
- Report Inappropriate Content
Pivot table help
Hello,
I'm trying to figure out how to make a pivot chart with dynamic totals but only for 1 expression. I'm trying to get the months across so that my expressions populate for each month selected. I'm also just trying to get a total for the order count, which is it's own field and not a Count().
Is it possible to have a pivot chart like my example below?
| September | October | Total | |||
|---|---|---|---|---|---|
| Customer | Order Count | Order Average | Order Count | Order Average | Total Order Count |
| Customer1 | 3 | 4 | 5 | 4 | 8 |
| Customer2 | 5 | 3 | 1 | 3 | 6 |
| Customer3 | 10 | 5 | 0 | 5 | 10 |
Thank you in advance
- Mark as New
- Bookmark
- Subscribe
- Mute
- Subscribe to RSS Feed
- Permalink
- Report Inappropriate Content
Hi,
Yes. It is possible.
Add your required dimensions and Expressions to the chart.
Drag Month to the row line and Drag columns and field to change your chart as per your requirement.
Thanks.
- Mark as New
- Bookmark
- Subscribe
- Mute
- Subscribe to RSS Feed
- Permalink
- Report Inappropriate Content
Hi David,
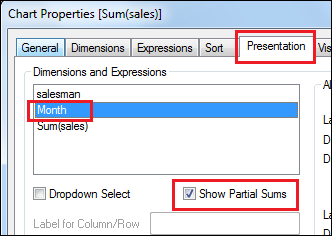
You can enable show partial sum option for the month dimension in presentation tab. Check the attachment for better understanding.
- Mark as New
- Bookmark
- Subscribe
- Mute
- Subscribe to RSS Feed
- Permalink
- Report Inappropriate Content
Hi,
If you have two expression and you want Total Sum of only one expression
then using partial sum you can not acheive it.
And I dont think so there is any way to acheive it.
Only If you hardcoded any of the dimension then we can try it.
Regards
Please appreciate our Qlik community members by giving Kudos for sharing their time for your query. If your query is answered, please mark the topic as resolved 🙂
- Mark as New
- Bookmark
- Subscribe
- Mute
- Subscribe to RSS Feed
- Permalink
- Report Inappropriate Content
Hi Tamil,
Partial sums would work, however, I have 2 expressions and I only want to show totals for 1 of the expressions
- Mark as New
- Bookmark
- Subscribe
- Mute
- Subscribe to RSS Feed
- Permalink
- Report Inappropriate Content
Hey Max,
Thanks for your response. I was afraid it wouldn't be possible without an overlay or hardcoding but it looks like I may not have a choice.