Unlock a world of possibilities! Login now and discover the exclusive benefits awaiting you.
- Qlik Community
- :
- All Forums
- :
- QlikView App Dev
- :
- Pivot total value different from sum of rows value
- Subscribe to RSS Feed
- Mark Topic as New
- Mark Topic as Read
- Float this Topic for Current User
- Bookmark
- Subscribe
- Mute
- Printer Friendly Page
- Mark as New
- Bookmark
- Subscribe
- Mute
- Subscribe to RSS Feed
- Permalink
- Report Inappropriate Content
Pivot total value different from sum of rows value
Hi, I'm not very experienced in QlikView and I need help to test a formula to calculate annual sales from sales data of quarter
The problem is that pivot total value is different from sum of rows value
for example in the grid
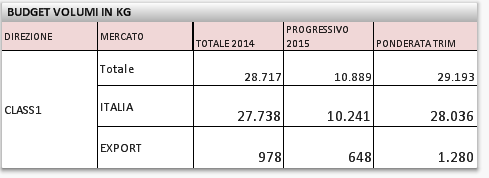
28036 + 1280 is different from total 29193
Can someone help me?
thanks
- Tags:
- pivot forecast
Accepted Solutions
- Mark as New
- Bookmark
- Subscribe
- Mute
- Subscribe to RSS Feed
- Permalink
- Report Inappropriate Content
The simplest way is to do the following:
- Change the chart type to a straight table (Properties - General - The lower table icon)
- Change the Total mode to "Sum of Rows" (Properties - Expressions - Total mode)
An alternative way, is to change the formula to an Aggr() function:
Sum( Aggr( <your current expression> , C_MERCATO_STORICO,D_DIREZIONE_FLD ))
This however will affect performance negatively.
HIC
- Mark as New
- Bookmark
- Subscribe
- Mute
- Subscribe to RSS Feed
- Permalink
- Report Inappropriate Content
Hi,
Try AGGR()
like
Sum(AGGR(SUM(YourExpression),Dimesion))
Regards
Please appreciate our Qlik community members by giving Kudos for sharing their time for your query. If your query is answered, please mark the topic as resolved 🙂
- Mark as New
- Bookmark
- Subscribe
- Mute
- Subscribe to RSS Feed
- Permalink
- Report Inappropriate Content
Thanks, I tried your solution but not working
- Mark as New
- Bookmark
- Subscribe
- Mute
- Subscribe to RSS Feed
- Permalink
- Report Inappropriate Content
Yes, the numbers are different - as they should be: You have a fairly complex formula in PONDERATA TRIM that contains a ratio between two aggregations, like
Sum( <calculation1> ) / Sum( <calculation2> )
This formula is calculated first for "ITALIA", then for "EXPORT", and finally for the entire scope. Such a calculation is not linear so there is no reason that the calculation for the entire scope should be the sum of the calculations for the smaller scopes.
Compare with a calculation of gross margin in percent:
Sum( GrossMarginInDollars ) / Sum( TurnoverInDollars )
There is no reason that this number for the entire company should be the sum of the different departments.
HIC
- Mark as New
- Bookmark
- Subscribe
- Mute
- Subscribe to RSS Feed
- Permalink
- Report Inappropriate Content
Thanks, I understand
Can you suggest me a way to have as total the sum of the values of the lines? In my example I would like to have 29316?
Is there some other formula to consider in forecact result the weight of the quarter?
thanks again
- Mark as New
- Bookmark
- Subscribe
- Mute
- Subscribe to RSS Feed
- Permalink
- Report Inappropriate Content
The simplest way is to do the following:
- Change the chart type to a straight table (Properties - General - The lower table icon)
- Change the Total mode to "Sum of Rows" (Properties - Expressions - Total mode)
An alternative way, is to change the formula to an Aggr() function:
Sum( Aggr( <your current expression> , C_MERCATO_STORICO,D_DIREZIONE_FLD ))
This however will affect performance negatively.
HIC
- Mark as New
- Bookmark
- Subscribe
- Mute
- Subscribe to RSS Feed
- Permalink
- Report Inappropriate Content
I will follow your input
thanks