Unlock a world of possibilities! Login now and discover the exclusive benefits awaiting you.
- Qlik Community
- :
- All Forums
- :
- QlikView App Dev
- :
- Plot longitude and latitude of postal codes in the...
- Subscribe to RSS Feed
- Mark Topic as New
- Mark Topic as Read
- Float this Topic for Current User
- Bookmark
- Subscribe
- Mute
- Printer Friendly Page
- Mark as New
- Bookmark
- Subscribe
- Mute
- Subscribe to RSS Feed
- Permalink
- Report Inappropriate Content
Plot longitude and latitude of postal codes in the correct aspect ratio in a QLikView scatter chart
I tried to plot the longitude and latitude of postal code data from the Netherlands in a QLikView scatter chart.So far I have this chart :
The data that I used is NL.zip, downloaded from GeoNames
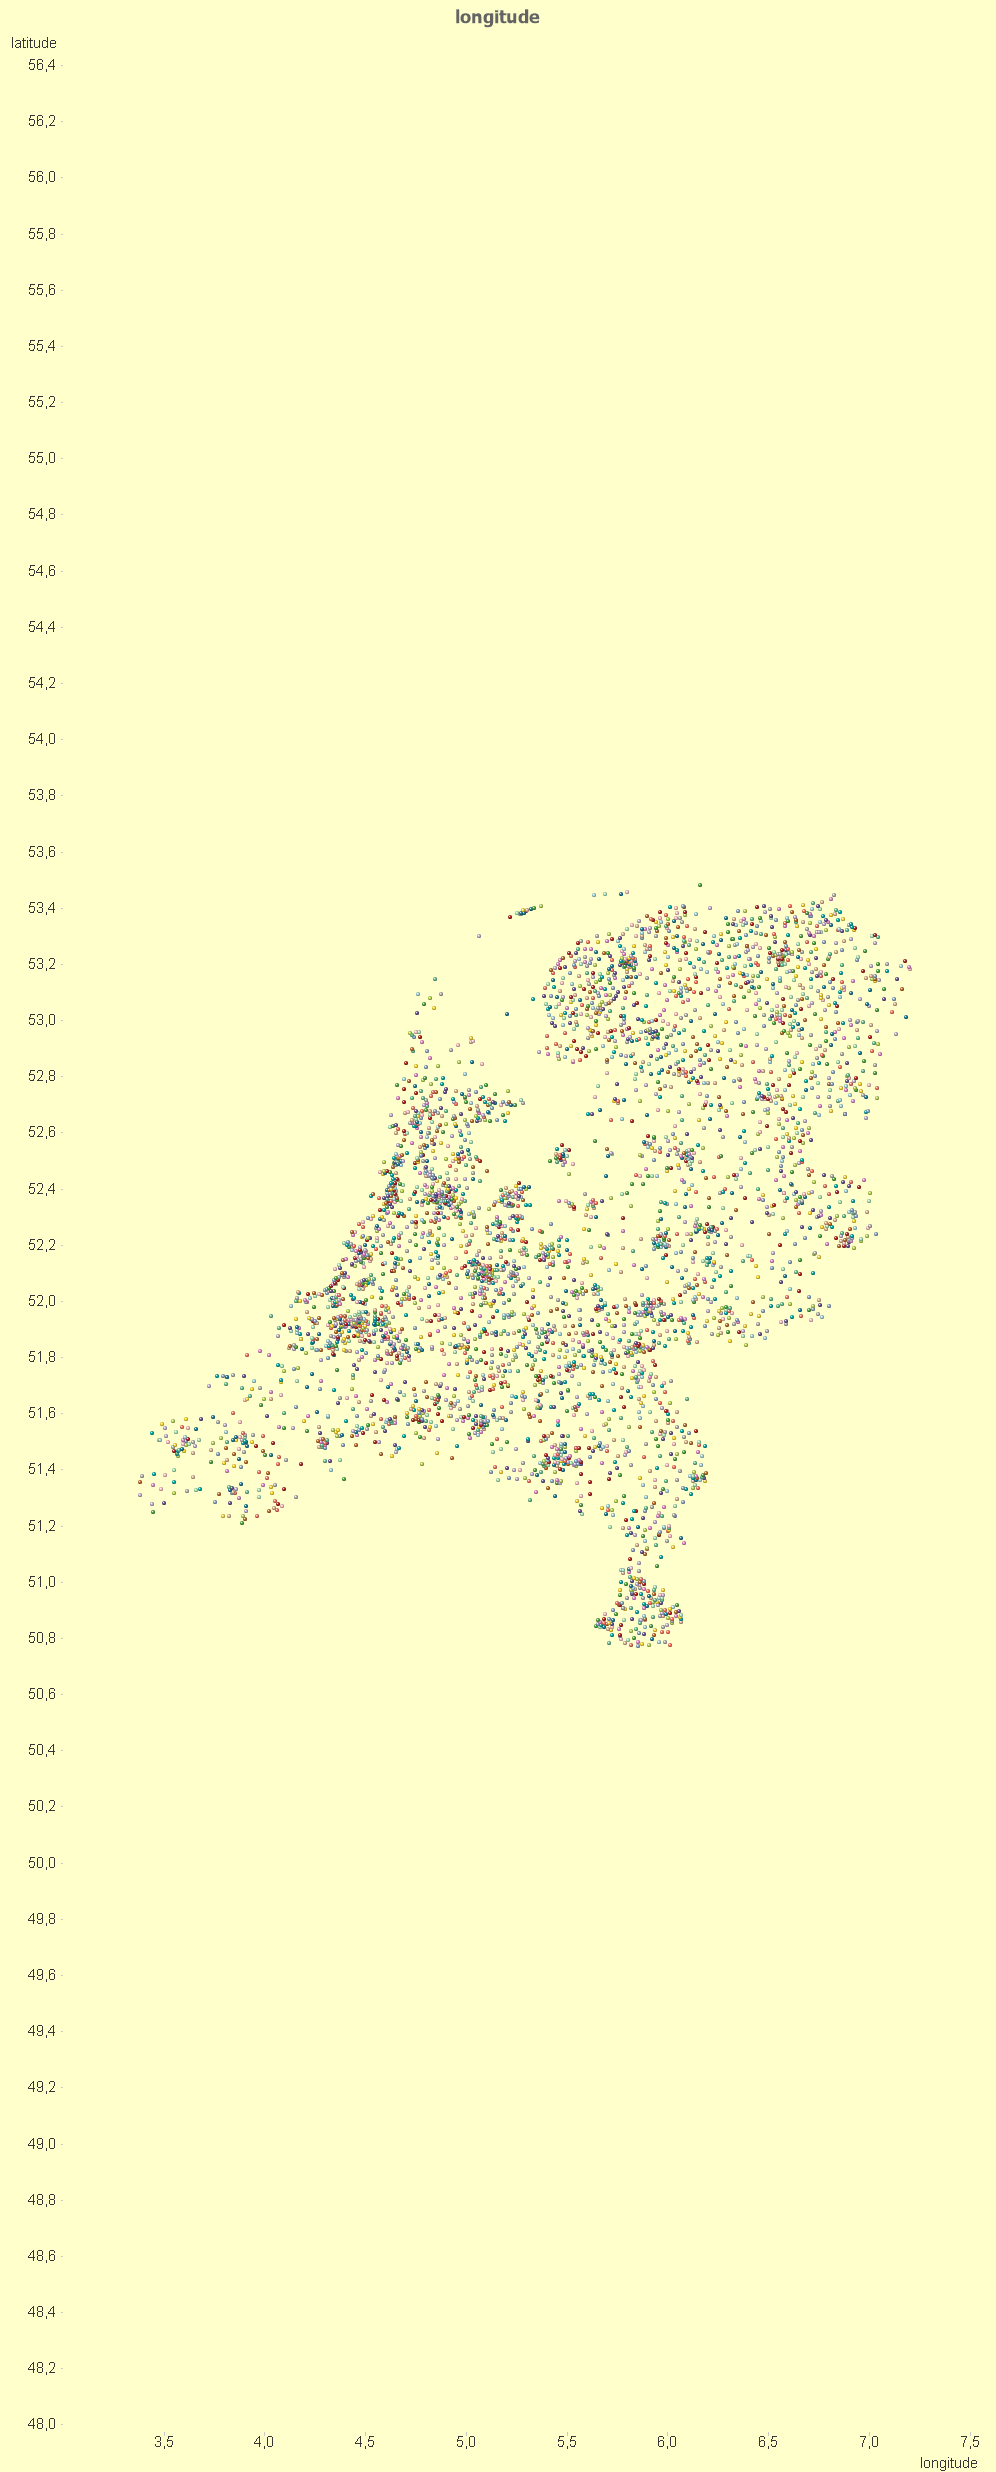
I want to remove the empty space below and above. How can I short the Y-axis from 50,8 to 53,6?
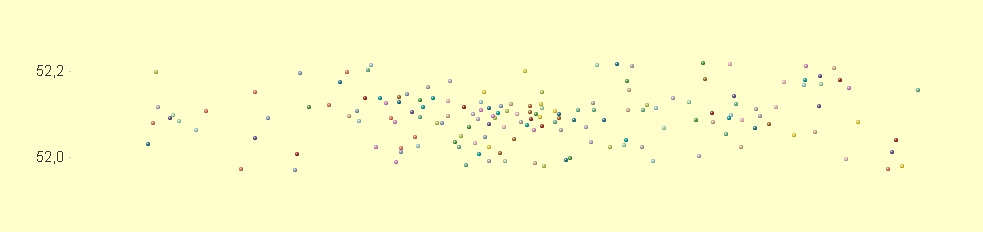
A second problem is zoom in :

When I perform the selection as above, I'd like to have this selection on the whole graph and keep the same aspect ratio. The result that I get now is shown below :
Things that I already did are :
Axes > tick of 'Forced 0' for both axes
Ticked of 'Show Legend'
Later I want to add a picture of the Netherlands as background and align the data points on the picture. If keeping the same aspect ratio the data points should be still aligned with the image while zooming in.
Accepted Solutions
- Mark as New
- Bookmark
- Subscribe
- Mute
- Subscribe to RSS Feed
- Permalink
- Report Inappropriate Content
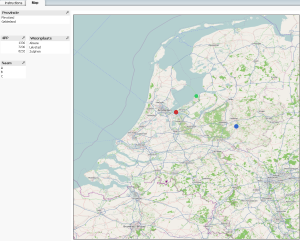
Ok, well here are the instructions and a screenshot
// 1. Open url: http://www.openstreetmap.org/
// 2. Click on "Export".
// 3. Adjust the map if you know the geo coordinates
// or adjust a map extract with your mouse.
// 4. Enter the minimum and maximum long- and latitude, shown to the left of the map:
SET vCoordinateMinX=3.24;
SET vCoordinateMaxX=7.35;
SET vCoordinateMinY=50.75;
SET vCoordinateMaxY=53.51;
// 5. Enter the width and height of the export-image, shown above the export-button:
// Tip: You can adjust the scale to modify the size of the map
SET vImageMaxX=933;
SET vImageMaxY=1073;
// 6. Export the map as image and save it on your computer.
// 7. Load your data. It has to contain the postcode
GeoInfo:
LOAD * Inline [Naam,4PP, Score
'A',7206,100
'B',1336,100
'C',8232,75
];
// Load geodata.
LEFT JOIN
LOAD * FROM ..\4pp.xls (biff, embedded labels, table is [4pp$]);
As X expression
=(Longitude-vCoordinateMinX) * (vImageMaxX / (vCoordinateMaxX-vCoordinateMinX))
As Y expression
=(Latitude-vCoordinateMinY) * (vImageMaxY / (vCoordinateMaxY-vCoordinateMinY))
Set the Axis settings Static Min to 0 for both axes
And the Static max to =vImageMaxX and =vImageMaxY
- Mark as New
- Bookmark
- Subscribe
- Mute
- Subscribe to RSS Feed
- Permalink
- Report Inappropriate Content
I once found this solution for creating a static map, but I don't think you will be able to zoom using a static picture. Instructions in the qvw.
- Mark as New
- Bookmark
- Subscribe
- Mute
- Subscribe to RSS Feed
- Permalink
- Report Inappropriate Content
Unfortunately I can't open the file.
- Mark as New
- Bookmark
- Subscribe
- Mute
- Subscribe to RSS Feed
- Permalink
- Report Inappropriate Content
Ok, well here are the instructions and a screenshot
// 1. Open url: http://www.openstreetmap.org/
// 2. Click on "Export".
// 3. Adjust the map if you know the geo coordinates
// or adjust a map extract with your mouse.
// 4. Enter the minimum and maximum long- and latitude, shown to the left of the map:
SET vCoordinateMinX=3.24;
SET vCoordinateMaxX=7.35;
SET vCoordinateMinY=50.75;
SET vCoordinateMaxY=53.51;
// 5. Enter the width and height of the export-image, shown above the export-button:
// Tip: You can adjust the scale to modify the size of the map
SET vImageMaxX=933;
SET vImageMaxY=1073;
// 6. Export the map as image and save it on your computer.
// 7. Load your data. It has to contain the postcode
GeoInfo:
LOAD * Inline [Naam,4PP, Score
'A',7206,100
'B',1336,100
'C',8232,75
];
// Load geodata.
LEFT JOIN
LOAD * FROM ..\4pp.xls (biff, embedded labels, table is [4pp$]);
As X expression
=(Longitude-vCoordinateMinX) * (vImageMaxX / (vCoordinateMaxX-vCoordinateMinX))
As Y expression
=(Latitude-vCoordinateMinY) * (vImageMaxY / (vCoordinateMaxY-vCoordinateMinY))
Set the Axis settings Static Min to 0 for both axes
And the Static max to =vImageMaxX and =vImageMaxY
- Mark as New
- Bookmark
- Subscribe
- Mute
- Subscribe to RSS Feed
- Permalink
- Report Inappropriate Content
Thanks you for this very clear answer, unfortunately I always get a Gateway Timeout while trying to export the map. I tried several times in the afternoon and morning.
- Mark as New
- Bookmark
- Subscribe
- Mute
- Subscribe to RSS Feed
- Permalink
- Report Inappropriate Content
Yes, unfortunately. Maybe there are some other sites or you could just make a screenshot. You'd have to guesstimate the coordinates....
I have attached the map for NL that I exported from openstreetmap once, it is the one used in the qvw, so all details are as described above.