Unlock a world of possibilities! Login now and discover the exclusive benefits awaiting you.
- Qlik Community
- :
- All Forums
- :
- QlikView App Dev
- :
- Plotting a line graph
- Subscribe to RSS Feed
- Mark Topic as New
- Mark Topic as Read
- Float this Topic for Current User
- Bookmark
- Subscribe
- Mute
- Printer Friendly Page
- Mark as New
- Bookmark
- Subscribe
- Mute
- Subscribe to RSS Feed
- Permalink
- Report Inappropriate Content
Plotting a line graph
Hi,
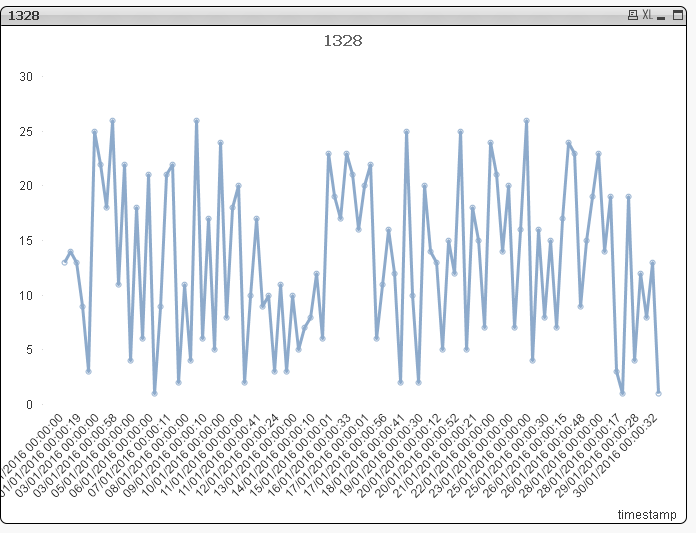
I would like to plot a graph similar to the one below. There are multiple values for the same date and in Qlikview we generally add a dimension (for the below eg. Date is the dimension) and one expression (sum(Result Values) ).
Is there a way where we can display multiple values for the same dimension value?
- Mark as New
- Bookmark
- Subscribe
- Mute
- Subscribe to RSS Feed
- Permalink
- Report Inappropriate Content
Is there a way where we can display multiple values for the same dimension value?
I don't think so. One expression can only return one result. A line chart like you posted above is not possible.
talk is cheap, supply exceeds demand
- Mark as New
- Bookmark
- Subscribe
- Mute
- Subscribe to RSS Feed
- Permalink
- Report Inappropriate Content
The only way might be if you can do something fancy with giving the data points marginally different timestamps for the date? then compressing the axis down to only show dates.... not sure... will play with that idea
- Mark as New
- Bookmark
- Subscribe
- Mute
- Subscribe to RSS Feed
- Permalink
- Report Inappropriate Content
Closest I can get I am afraid, will play more if I have time, there MUST be a way
- Mark as New
- Bookmark
- Subscribe
- Mute
- Subscribe to RSS Feed
- Permalink
- Report Inappropriate Content
Can I create a scatter graph instead of line graph?