Unlock a world of possibilities! Login now and discover the exclusive benefits awaiting you.
- Qlik Community
- :
- All Forums
- :
- QlikView App Dev
- :
- Re: Price Volume Mix Analysis Dashboard
- Subscribe to RSS Feed
- Mark Topic as New
- Mark Topic as Read
- Float this Topic for Current User
- Bookmark
- Subscribe
- Mute
- Printer Friendly Page
- Mark as New
- Bookmark
- Subscribe
- Mute
- Subscribe to RSS Feed
- Permalink
- Report Inappropriate Content
Price Volume Mix Analysis Dashboard
I am trying to create a dashboard to analyse Price Volume Mix between two periods of time that the user can select using sliders within the dashboard. I also want to maintain customer and product granularity. I'm trying to achieve a load that looks like the diagram below:
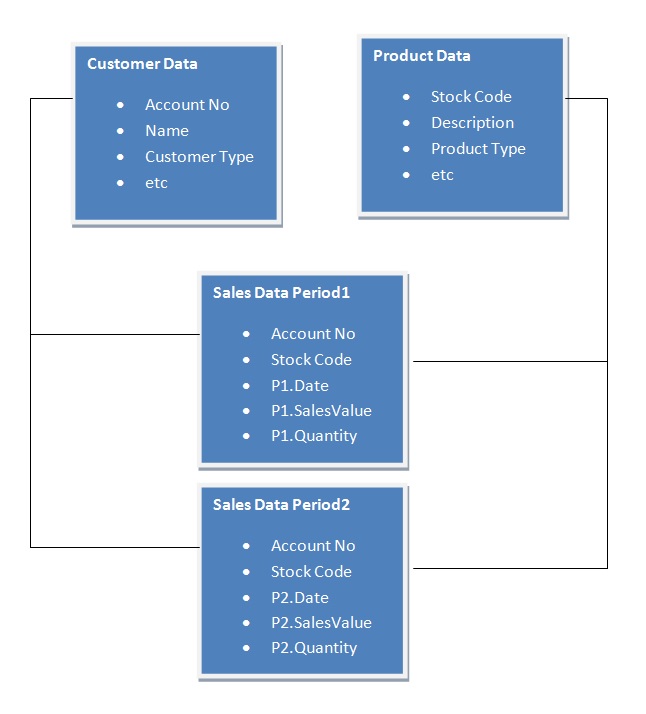
I'm having trouble doing this without creating loops or synthetic keys, does any one have any ideas?
- « Previous Replies
-
- 1
- 2
- Next Replies »
- Mark as New
- Bookmark
- Subscribe
- Mute
- Subscribe to RSS Feed
- Permalink
- Report Inappropriate Content
- Mark as New
- Bookmark
- Subscribe
- Mute
- Subscribe to RSS Feed
- Permalink
- Report Inappropriate Content
Hi Chris,
To avoid the loop you can concatenate the Sales Data tables adding a new field to discriminate between periods.
Something like:
[Sales Data]:
LOAD *,
'Period 1' AS Source
FROM ... Sales Data Period 1
CONCATENATE ([Sales Data])
LOAD *,
'Period 2' AS Source
FROM ... Sales Data Period 2
Regards,
David
- Mark as New
- Bookmark
- Subscribe
- Mute
- Subscribe to RSS Feed
- Permalink
- Report Inappropriate Content
Maybe this will helps you
- Mark as New
- Bookmark
- Subscribe
- Mute
- Subscribe to RSS Feed
- Permalink
- Report Inappropriate Content
It's probably worth mentioning that I've aggregated my Sales Data so where I have date described above I actually mean 01-MM-YYYY.
I also tried concatenating the sales data this clears any loop or synthetic key, however, the result is as follows:
Account No | Stock Code | P1.Date | P1.SalesValue | P1.Quantity | P2.Date | P2.SalesValue | P2.Quantity |
1 | 1 | 01/01/2017 | 10 | 10 | - | - | - |
1 | 1 | - | - | - | 01/01/2017 | 10 | 10 |
Therefore, any date selections made in the slider for P1.Date are deselected as soon as you make a selection in the P2.Date.
- Mark as New
- Bookmark
- Subscribe
- Mute
- Subscribe to RSS Feed
- Permalink
- Report Inappropriate Content
It looks like you did not want to read about the canonical dates (see above).
- Mark as New
- Bookmark
- Subscribe
- Mute
- Subscribe to RSS Feed
- Permalink
- Report Inappropriate Content
I did read it but I don't understand how it can help me.
- Mark as New
- Bookmark
- Subscribe
- Mute
- Subscribe to RSS Feed
- Permalink
- Report Inappropriate Content
Hi,
Rename the fields like below:
[Sales Data]:
LOAD
[Account No]
[Stock Code]
[P1.Date] AS Date
[P1.SalesValue] AS SalesValue
[P1.Quantity] AS Quantity
'Period 1' AS Source
FROM ... Sales Data Period 1
CONCATENATE ([Sales Data])
LOAD
[Account No]
[Stock Code]
[P2.Date] AS Date
[P2.SalesValue] AS SalesValue
[P2.Quantity] AS Quantity
'Period 2' AS Source
FROM ... Sales Data Period 2
You should end up with the following table:
| Account No | Stock Code | Date | SalesValue | Quantity | Source |
1 | 1 | 01/01/2017 | 10 | 10 | Period 1 |
1 | 1 | 01/01/2017 | 10 | 10 | Period 2 |
If you want to sum only the values for one table then you will need to use set analysis:
Sum({$<Source = {'Period1'}>}SalesValue) => 10
Regards,
David
- Mark as New
- Bookmark
- Subscribe
- Mute
- Subscribe to RSS Feed
- Permalink
- Report Inappropriate Content
Thanks David, I think the way forward is set analysis and often the simple solutions are the best, I'm just loading 3 tables: Customer, Product and Sales. I am then setting the period start and end dates using 4 variables which are set using sliders:
P1Start
P1End
P2Start
P2End
Therefore:
P1 Sales =
sum({$<DateNumeric={">=$(vP1Start) <=$(vP1End)"}>}SalesValue)
Regards
Chris
- Mark as New
- Bookmark
- Subscribe
- Mute
- Subscribe to RSS Feed
- Permalink
- Report Inappropriate Content
Or, you can use just 2 variables plus the Source flag in set analysis:
P1 Sales = sum({$<Source = {'Period 1'}, DateNumeric={">=$(vStart) <=$(vEnd)"}>}SalesValue)
P2 Sales = sum({$<Source = {'Period 2'}, DateNumeric={">=$(vStart) <=$(vEnd)"}>}SalesValue)
Regards,
David
- « Previous Replies
-
- 1
- 2
- Next Replies »