Unlock a world of possibilities! Login now and discover the exclusive benefits awaiting you.
- Qlik Community
- :
- All Forums
- :
- QlikView App Dev
- :
- Problem rangesum for multiple years
- Subscribe to RSS Feed
- Mark Topic as New
- Mark Topic as Read
- Float this Topic for Current User
- Bookmark
- Subscribe
- Mute
- Printer Friendly Page
- Mark as New
- Bookmark
- Subscribe
- Mute
- Subscribe to RSS Feed
- Permalink
- Report Inappropriate Content
Problem rangesum for multiple years
Dear all,
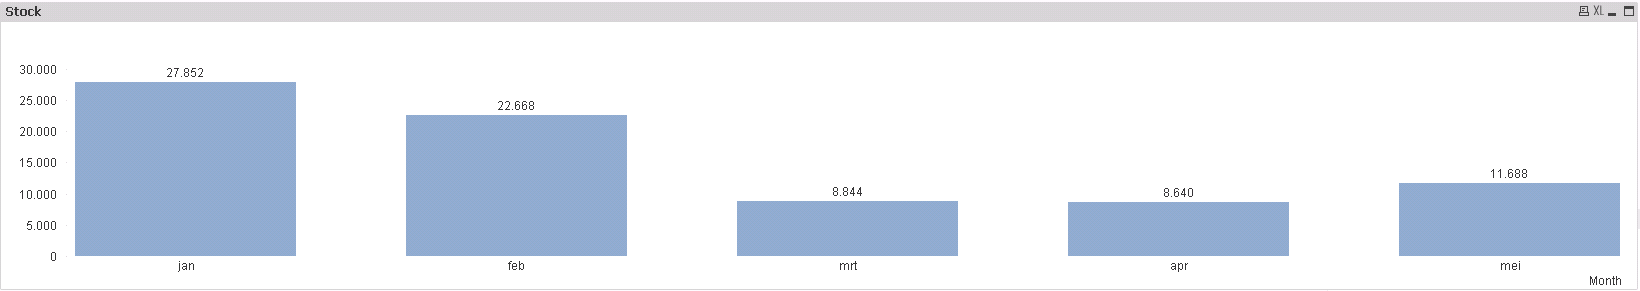
I have a problem when trying to create a chart that displays our stock-levels over multiple years.
I have a table that contains a line for every booking (pos / neg) over the past years.
The fields I use are Product, Date, QTY.
So when I need to show the stock on 31/12/2014 in the graph, I will need to calculate every booking up until 31/12/2014. I want to show 12 months in a graph, displaying the correct stock at that time. Also I need to be able to show the stock for a previous year.
I use the following function and it works, but only if have no bookings older then 12 months.
sum( Aggr( rangesum( above ( Sum( {1} [QTY]),0,12)), Month))
I then tried the following function:
RangeSum(above(sum(QTY),0, RowNo()))
The problem with this formula is that it does not calculate the data from previous years.
Can anyone please assist me with this?
Best Regards
Bert
- Mark as New
- Bookmark
- Subscribe
- Mute
- Subscribe to RSS Feed
- Permalink
- Report Inappropriate Content
My guess is that your Month field is simply the month and not related to the year. So if you have data from several years you get the sum of all the years for, say january, since every year will have a month january. Consider creating a monthyear field and use that instead: date(monthstart(MyDateField),'MMM YY') as MonthYear
talk is cheap, supply exceeds demand
- Mark as New
- Bookmark
- Subscribe
- Mute
- Subscribe to RSS Feed
- Permalink
- Report Inappropriate Content
I tried this already and the data is correct when I use set analysis to include all data and show all data.
But when I make a selection and show only 12 months, I get wrong data.
So I need a way to show only 12 months, but it needs to calculate the data from start to end.
Or is my only option that I need to add a new record to the table with the end-stock from last year in januari?
- Mark as New
- Bookmark
- Subscribe
- Mute
- Subscribe to RSS Feed
- Permalink
- Report Inappropriate Content
I prefer to use variables when working with date ranges, I feel it provides more flexibility
check this post for more details