Unlock a world of possibilities! Login now and discover the exclusive benefits awaiting you.
- Qlik Community
- :
- All Forums
- :
- QlikView App Dev
- :
- Re: Problem with graph
- Subscribe to RSS Feed
- Mark Topic as New
- Mark Topic as Read
- Float this Topic for Current User
- Bookmark
- Subscribe
- Mute
- Printer Friendly Page
- Mark as New
- Bookmark
- Subscribe
- Mute
- Subscribe to RSS Feed
- Permalink
- Report Inappropriate Content
Problem with graph
Hello everybody,
I have a litle query. I'm doing a graph and I like to show all the values of my count(ID). Sometimes this operation is 0 and I need to show all the values, although this has been 0.
I do a graph of lines with all dates of a year.
¿Is it possible?
I hope any suggestion
Sorry for my bad English....
- Tags:
- graph
- « Previous Replies
-
- 1
- 2
- Next Replies »
- Mark as New
- Bookmark
- Subscribe
- Mute
- Subscribe to RSS Feed
- Permalink
- Report Inappropriate Content
What exactly you want?
You can try like this:
=Count(distinct ID)
- Mark as New
- Bookmark
- Subscribe
- Mute
- Subscribe to RSS Feed
- Permalink
- Report Inappropriate Content
go to presentation tab
untick suppress zero values
- Mark as New
- Bookmark
- Subscribe
- Mute
- Subscribe to RSS Feed
- Permalink
- Report Inappropriate Content
Hello,
I want to show all the dates although count(ID) = 0
Example
1/1 count(ID) = 0
2/1 count(ID) = 5
3/1 count(ID) = 6
4/1 count(ID) = 0
5/1 count(ID) = 8
I need to paint the 5 values, although 2/5 are 0
¿it is possible?
- Mark as New
- Bookmark
- Subscribe
- Mute
- Subscribe to RSS Feed
- Permalink
- Report Inappropriate Content
any sample data?
- Mark as New
- Bookmark
- Subscribe
- Mute
- Subscribe to RSS Feed
- Permalink
- Report Inappropriate Content
Go to Chart properties and Presentation Tab.
Untick Supress Zero Values.
Tick Zero on Bars.
In Dimensions tab,
Select Dimension and Tick Show All Values.
Regards,
Anjali Gupta
- Mark as New
- Bookmark
- Subscribe
- Mute
- Subscribe to RSS Feed
- Permalink
- Report Inappropriate Content
Hello,
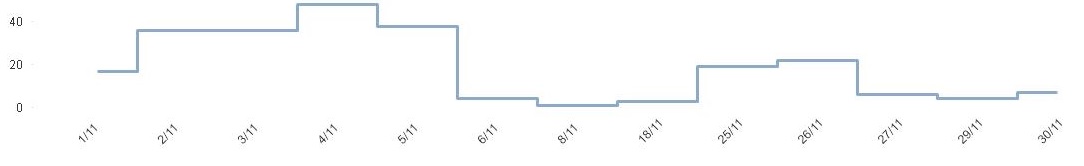
This is a example of graph. Count(ID) of the days: 7,9,10,11,12, etc is 0, by this reason the graph don't show the values of day
I unckeck suppress zero values, but this don't work
¿Any suggestion more?
- Mark as New
- Bookmark
- Subscribe
- Mute
- Subscribe to RSS Feed
- Permalink
- Report Inappropriate Content
Provide sample data please..
- Mark as New
- Bookmark
- Subscribe
- Mute
- Subscribe to RSS Feed
- Permalink
- Report Inappropriate Content
Try This:
Go to Chart properties and Presentation Tab.
Untick Supress Zero Values.
Tick Zero on Bars.
- Mark as New
- Bookmark
- Subscribe
- Mute
- Subscribe to RSS Feed
- Permalink
- Report Inappropriate Content
Hello,
I add an example with my trouble. I have all days in November but I don't have ID all the days. I like show all days although count(ID) = 0
Example :
1/11 --> count(ID) = 2
4/11 --> count(ID) = 3
12/11--> count(ID) = 0
13/11-->count(ID) = 0
14/11->count(ID) = 0
- « Previous Replies
-
- 1
- 2
- Next Replies »