Unlock a world of possibilities! Login now and discover the exclusive benefits awaiting you.
- Qlik Community
- :
- All Forums
- :
- QlikView App Dev
- :
- Re: Problems using the accumulated
- Subscribe to RSS Feed
- Mark Topic as New
- Mark Topic as Read
- Float this Topic for Current User
- Bookmark
- Subscribe
- Mute
- Printer Friendly Page
- Mark as New
- Bookmark
- Subscribe
- Mute
- Subscribe to RSS Feed
- Permalink
- Report Inappropriate Content
Problems using the accumulated
Hi!
I have a trouble using cumulative function:
I have months (Month field) and a value for each month (Index),and I need to create one chart showing the points accumulated by months.
The problem I have is that the values for each month are percentages(value index is percentage),
so i can not simply use the cumulative function cause it is use for natural numbers(sum), and i have percentages.
One example:
What I need is for March show the point:
Point = (avg(values for Index in January) + avg(values for index in February )+ avg(values for index in March) / 3
and so on for April ... etc
Can anyone tell me how to get it?
Activating the cumulative tab does not work properly because they are PERCENTAGES what I have, not natural numbers.
Thanks a lot!
- Tags:
- acumulate
Accepted Solutions
- Mark as New
- Bookmark
- Subscribe
- Mute
- Subscribe to RSS Feed
- Permalink
- Report Inappropriate Content
Problem solved!
- Mark as New
- Bookmark
- Subscribe
- Mute
- Subscribe to RSS Feed
- Permalink
- Report Inappropriate Content
Hi Paula,
íf it does not work on the GUI, try to solve it in the script.
The basis of your percentages that you display are some numbers in the table, right?
So you'll have to build a cumulative total of that value, using the PREVIOUS() function - one per month.
- First you'll have to sort your table by month or by date if you have any.
- Then you can sum up all the records where the month is the same.
=> Voila. You have a cumulative total per month that you can use to calculate a percentage.
HTH
Best regards,
DataNibbler
- Mark as New
- Bookmark
- Subscribe
- Mute
- Subscribe to RSS Feed
- Permalink
- Report Inappropriate Content
hi ,
for cumulative calculation plz refer "RangeAvg" function .
Regards,
Harish
- Mark as New
- Bookmark
- Subscribe
- Mute
- Subscribe to RSS Feed
- Permalink
- Report Inappropriate Content
hi ,
for cumulative calculation plz refer "RangeAvg" function .
Regards,
Harish
- Mark as New
- Bookmark
- Subscribe
- Mute
- Subscribe to RSS Feed
- Permalink
- Report Inappropriate Content
Hi DataNibbler,
thanks for your support.
Let me explain again the problem ! 
I have this fields
Month Provider Index
01_2012 Pepe 100
01_2012 Jose 100
01_2012 Ramon 98
01_2012 Juan 100
02_2012 Pepe 65
02_2012 Jose 100
02_2012 Ramon 72
03_2012 Pepe 100
03_2012 Juan 100
04_2012 Pepe 89
04_2014 Ramon 92
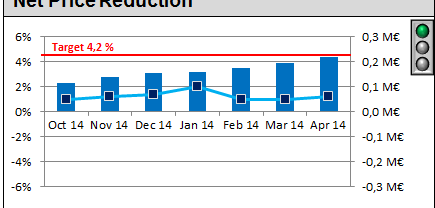
I want to create a mixed chart (bar chart with lines) like the photo i
attached(photo1).
I have achieved the expression fot the bar chart: avg(), and if i want
the accumulated , i will active "acumular" (pantallazo1), but i have percentage
values (100, 100, 98... etc)
and i don't know how to achieve the chart i have to create. 
Thanks for yout time
El 3 de septiembre de 2014 a las 11:03 DataNibbler <qcwebmaster@qlikview.com>
escribió:
Qlik Community <http://community.qlik.com/>
Problems using the accumulated
reply from DataNibbler
<http://community.qlik.com/people/DataNibbler?et=watches.email.thread> in App
Development - View the full discussion
<http://community.qlik.com/message/600416?et=watches.email.thread#600416>
>
- Mark as New
- Bookmark
- Subscribe
- Mute
- Subscribe to RSS Feed
- Permalink
- Report Inappropriate Content
Problem solved!