Unlock a world of possibilities! Login now and discover the exclusive benefits awaiting you.
- Qlik Community
- :
- All Forums
- :
- QlikView App Dev
- :
- Pyramid chart in QlikView
- Subscribe to RSS Feed
- Mark Topic as New
- Mark Topic as Read
- Float this Topic for Current User
- Bookmark
- Subscribe
- Mute
- Printer Friendly Page
- Mark as New
- Bookmark
- Subscribe
- Mute
- Subscribe to RSS Feed
- Permalink
- Report Inappropriate Content
Pyramid chart in QlikView
Hi All,
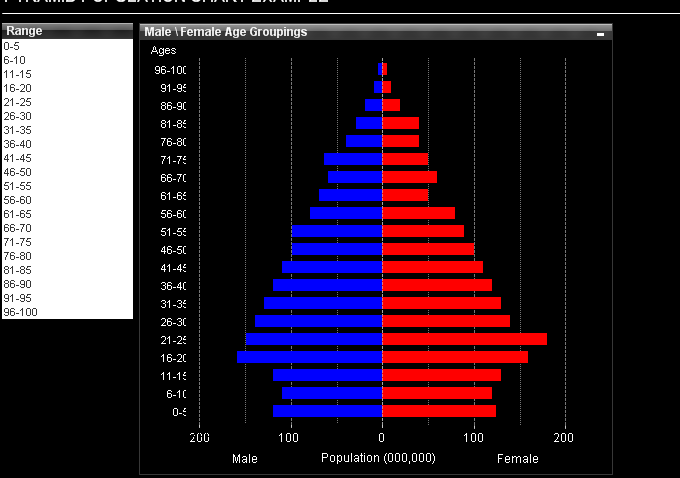
We have to develop the chart type as per attached image in QlikView.
Kindly share your thoughts if you have anyone had implemented similar kind of chart in QlikView.
Regards,
Punit
- Tags:
- pyramid
- Mark as New
- Bookmark
- Subscribe
- Mute
- Subscribe to RSS Feed
- Permalink
- Report Inappropriate Content
- Mark as New
- Bookmark
- Subscribe
- Mute
- Subscribe to RSS Feed
- Permalink
- Report Inappropriate Content
May be mot exactly but workaround I would suggest...
Take a Pyramid Image from google and then use Text box and Line Object Combination to show Data for Pyramids
- Mark as New
- Bookmark
- Subscribe
- Mute
- Subscribe to RSS Feed
- Permalink
- Report Inappropriate Content
- Mark as New
- Bookmark
- Subscribe
- Mute
- Subscribe to RSS Feed
- Permalink
- Report Inappropriate Content
Hi,
Data:
Data:
LOAD * INLINE [
    Range, M, F
    0-5, 120, 125
    6-10, 110, 120
    11-15, 120, 130
    16-20, 160, 160
    21-25, 150, 180
    26-30, 140, 140
    31-35, 130, 130
    36-40, 120, 120
    41-45, 110, 110
    46-50, 100, 100
    51-55, 100, 90
    56-60, 80, 80
    61-65, 70, 50
    66-70, 60, 60
    71-75, 65, 50
    76-80, 40, 40
    81-85, 30, 40
    86-90, 20, 20
    91-95, 10, 10
    96-100, 5, 5
];
Front End:
- Create two bar charts,
- Dimension:Range and Expression: =sum(M*-1)
- Dimension:Range and Expression: =sum(F)
- Then change style of Chart and axes as of your requirement.
HTH,
PFA,
-Hirish
“Aspire to Inspire before we Expire!”
- Mark as New
- Bookmark
- Subscribe
- Mute
- Subscribe to RSS Feed
- Permalink
- Report Inappropriate Content
Hi balrajahlawat
I have seen the post you have added in above, but they didn't solve the purpose.
May be if you can elaborate more on the workaround will help.
Thanks,
Punit
- Mark as New
- Bookmark
- Subscribe
- Mute
- Subscribe to RSS Feed
- Permalink
- Report Inappropriate Content
Hi ,
Check this,
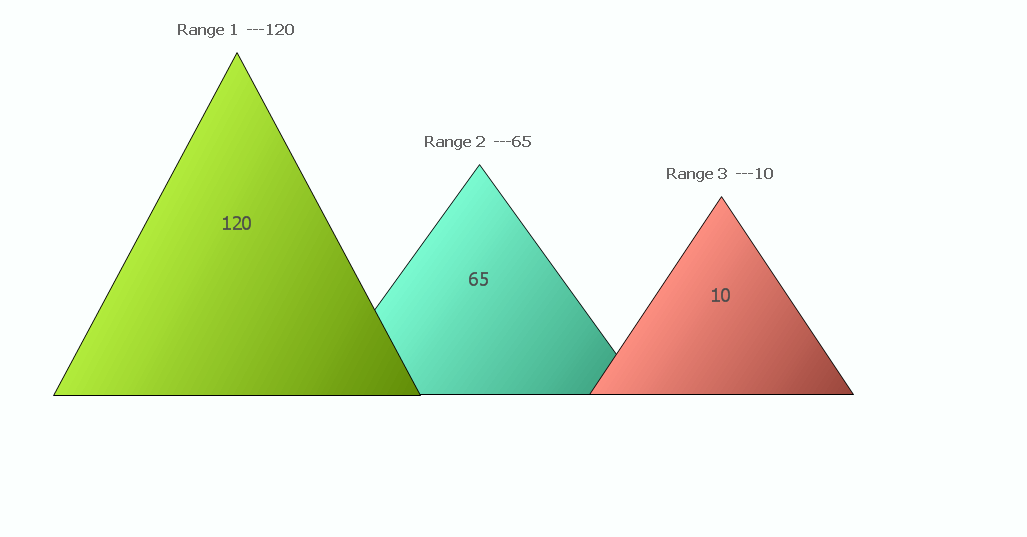
Customisation funnel chart,
Hope this helps,
Regards,
Hirish
“Aspire to Inspire before we Expire!”