Unlock a world of possibilities! Login now and discover the exclusive benefits awaiting you.
- Qlik Community
- :
- All Forums
- :
- QlikView App Dev
- :
- Qlik Sense Custom Color by Dimension expression
- Subscribe to RSS Feed
- Mark Topic as New
- Mark Topic as Read
- Float this Topic for Current User
- Bookmark
- Subscribe
- Mute
- Printer Friendly Page
- Mark as New
- Bookmark
- Subscribe
- Mute
- Subscribe to RSS Feed
- Permalink
- Report Inappropriate Content
Qlik Sense Custom Color by Dimension expression
Hello
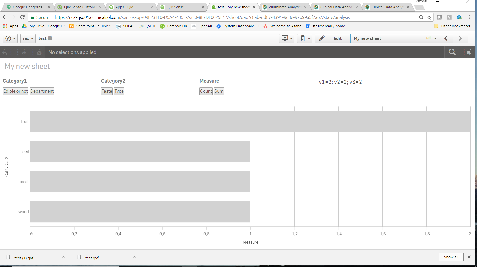
I've got a stacked bar chart with two dimensions (First, Second) and one measure (Measure).
The chart's second dimension (Second) is specified by an expression and is based on the value of a variable:
fx = if ($(myVar)=1, [DimensionX], [DimensionY])
For the coloration I would like the colors to be based on the value(s) of the active dimension; ie, I need to dynamically color by dimension.
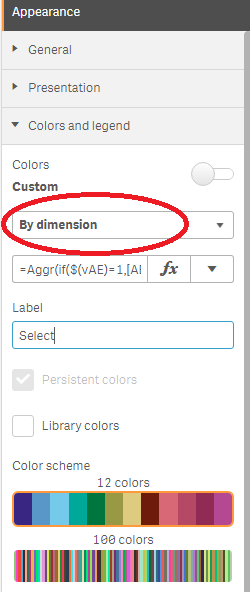
Under the Colors setting I chose Custom > By Dimension and specified the above expression in the Dimension expression box.
This does not work. All of the colors turn to gray!
Some observations from playing around:
- specifying either [DimensionX] or [DimensionY] alone in the Dimension expression box displays colors, but obviously only when myVar is set to match the value I've specified there. Since I need to dynamically switch between them, this is not a solution.
- it appears that anything in the expression box other than just [DimensionX] or [DimensionY] fails. For example the expression: if(true(),[DimensionX]) fails even when myVar=1.
- if there is anything (including whitespace!!!) either before or after the [DimensionX], that fails too.
- It's like they put an expression editor in the Custom Colors By Dimension setting, but you're not supposed to put an expression in it.
Thanks for any suggestions.
- « Previous Replies
-
- 1
- 2
- Next Replies »
Accepted Solutions
- Mark as New
- Bookmark
- Subscribe
- Mute
- Subscribe to RSS Feed
- Permalink
- Report Inappropriate Content
I've consulted with Qlik support. They've verified that it's a bug in Qlik and has been addressed in the latest version.
- Mark as New
- Bookmark
- Subscribe
- Mute
- Subscribe to RSS Feed
- Permalink
- Report Inappropriate Content
Hi Steven, color by expression expect a color code, ie:
If(ThisYearSales>LastYearSales, Green(), RGB(255,0,0))
In your case:
if ($(myVar)=1, Color1, Color2)
https://help.qlik.com/en-US/sense/November2017/Subsystems/Hub/Content/Colors/color-by-expression.htm
To keep a color for each dimension value you can try with:
if ($(myVar)=1, Color(FieldIndex('DimensionX', [DimensionX])), Color(FieldIndex('DimensionY', [DimensionY])))
- Mark as New
- Bookmark
- Subscribe
- Mute
- Subscribe to RSS Feed
- Permalink
- Report Inappropriate Content
Just to be clear, I'm using the expression function under Color by Dimension, not Color by Expression.
And it seems that (at least in this version of QlikSense) anything but a single dimension name; eg [Dimension1], in the expression box causes loss of all color.
- Mark as New
- Bookmark
- Subscribe
- Mute
- Subscribe to RSS Feed
- Permalink
- Report Inappropriate Content
It needs to return only one value and Aggr() can return more than one value, set the expression as:
=if($(myVar)=1, [DimensionX], [DimensionY]) // With the starting '='
This doesn't works?
- Mark as New
- Bookmark
- Subscribe
- Mute
- Subscribe to RSS Feed
- Permalink
- Report Inappropriate Content
I agree what you've specified should work. But it doesn't.
The only way I can make it work is if I express it as such:
$(=chr(39)&if(myVar=1,'DimensionX','DimensionY')&chr(39))
Which to me seems like a unnecessarily complicated expression.
- Mark as New
- Bookmark
- Subscribe
- Mute
- Subscribe to RSS Feed
- Permalink
- Report Inappropriate Content
It works for me, have you set the starting '='?
- Mark as New
- Bookmark
- Subscribe
- Mute
- Subscribe to RSS Feed
- Permalink
- Report Inappropriate Content
My chart is a little more complicated. I've modified your example to include an instance of what I'm seeing.
I cannot get proper segment colors to appear without doing what I've described earlier.
Perhaps you can make it work? I appreciate your assistance.
- Mark as New
- Bookmark
- Subscribe
- Mute
- Subscribe to RSS Feed
- Permalink
- Report Inappropriate Content
I tried "=if($(var2)=1,D3,D4)" and seems to work, can you try?
- Mark as New
- Bookmark
- Subscribe
- Mute
- Subscribe to RSS Feed
- Permalink
- Report Inappropriate Content
Seems to work in this instance, let me apply it to my original application and see.
- Mark as New
- Bookmark
- Subscribe
- Mute
- Subscribe to RSS Feed
- Permalink
- Report Inappropriate Content
One final modification: Gave the fields slightly more complex names and qualified them. This is closer to our actual app now.
- « Previous Replies
-
- 1
- 2
- Next Replies »