Unlock a world of possibilities! Login now and discover the exclusive benefits awaiting you.
- Qlik Community
- :
- All Forums
- :
- QlikView App Dev
- :
- Re: QlikView Area Chart with negative values
- Subscribe to RSS Feed
- Mark Topic as New
- Mark Topic as Read
- Float this Topic for Current User
- Bookmark
- Subscribe
- Mute
- Printer Friendly Page
- Mark as New
- Bookmark
- Subscribe
- Mute
- Subscribe to RSS Feed
- Permalink
- Report Inappropriate Content
QlikView Area Chart with negative values
Hi,
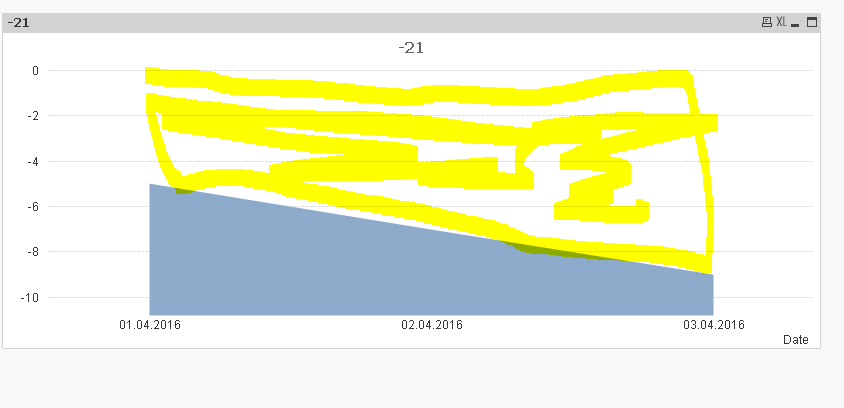
I'm trying to draw a line chart with an "Area Chart" style, but having negative values. Unexpectedly, the area from the bottom to the negative value (blue area) is filled, but I would need it from the 0 x-axis to the negativ value (yellow area).
I've seen similar questions here, but non of them is marked as resolved. Is there really no way to achive this?
KR, Nigel
Accepted Solutions
- Mark as New
- Bookmark
- Subscribe
- Mute
- Subscribe to RSS Feed
- Permalink
- Report Inappropriate Content
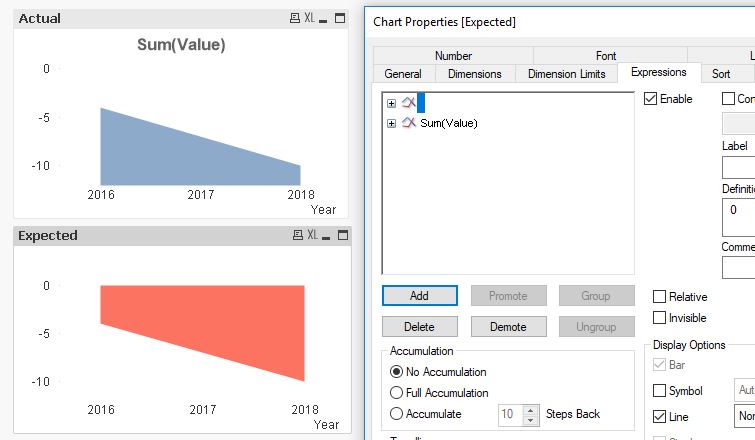
Like this?
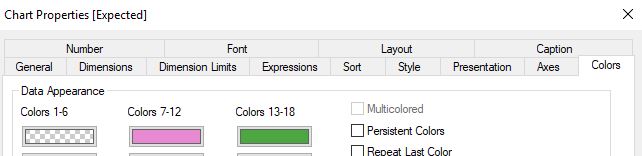
You could add another dummy expression as 0, promote it to first expression, and then make the first color 100% transparent in color tab.
- Mark as New
- Bookmark
- Subscribe
- Mute
- Subscribe to RSS Feed
- Permalink
- Report Inappropriate Content
Like this?
You could add another dummy expression as 0, promote it to first expression, and then make the first color 100% transparent in color tab.
- Mark as New
- Bookmark
- Subscribe
- Mute
- Subscribe to RSS Feed
- Permalink
- Report Inappropriate Content
Hi Tresesco,
that's exactly what I needed. But now, just as I have solved my first problem, I have another question: Would it be possible to show another line in this chart (additionaly), but as a line and not as an area?