Unlock a world of possibilities! Login now and discover the exclusive benefits awaiting you.
- Qlik Community
- :
- All Forums
- :
- QlikView App Dev
- :
- QlikView Bar Charting
Options
- Subscribe to RSS Feed
- Mark Topic as New
- Mark Topic as Read
- Float this Topic for Current User
- Bookmark
- Subscribe
- Mute
- Printer Friendly Page
Turn on suggestions
Auto-suggest helps you quickly narrow down your search results by suggesting possible matches as you type.
Showing results for
Anonymous
Not applicable
2015-10-22
02:48 AM
- Mark as New
- Bookmark
- Subscribe
- Mute
- Subscribe to RSS Feed
- Permalink
- Report Inappropriate Content
QlikView Bar Charting
I have the following straight table:
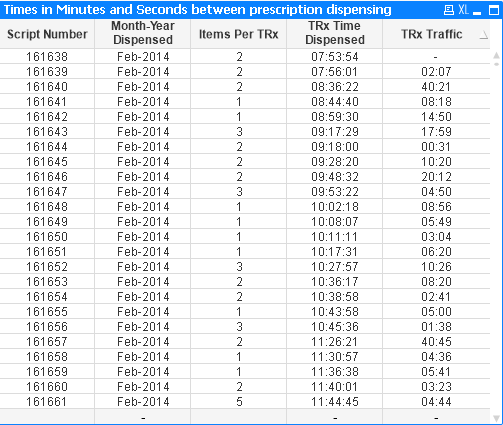
TRx Traffic is the interval time between TRX Time dispensed. I am trying to plot Average TRx Traffic versus YearMonth (using recommendations from Settu Perlasamy - Qlik Community member) with the following results:
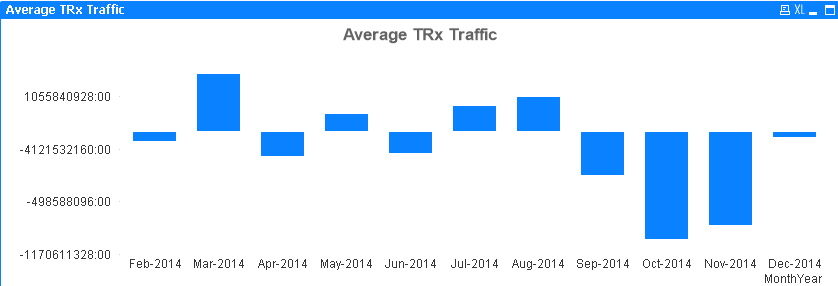
The above is obviously wrong. Please find attached my QVW document. Any help in correcting this. I should be able to filter by date and Branch.
Regards.
- Tags:
- charting
239 Views
1 Reply
Master III
2015-10-22
02:54 AM
- Mark as New
- Bookmark
- Subscribe
- Mute
- Subscribe to RSS Feed
- Permalink
- Report Inappropriate Content
175 Views