Unlock a world of possibilities! Login now and discover the exclusive benefits awaiting you.
- Qlik Community
- :
- All Forums
- :
- QlikView App Dev
- :
- Qlikmaps -legend
- Subscribe to RSS Feed
- Mark Topic as New
- Mark Topic as Read
- Float this Topic for Current User
- Bookmark
- Subscribe
- Mute
- Printer Friendly Page
- Mark as New
- Bookmark
- Subscribe
- Mute
- Subscribe to RSS Feed
- Permalink
- Report Inappropriate Content
Qlikmaps -legend
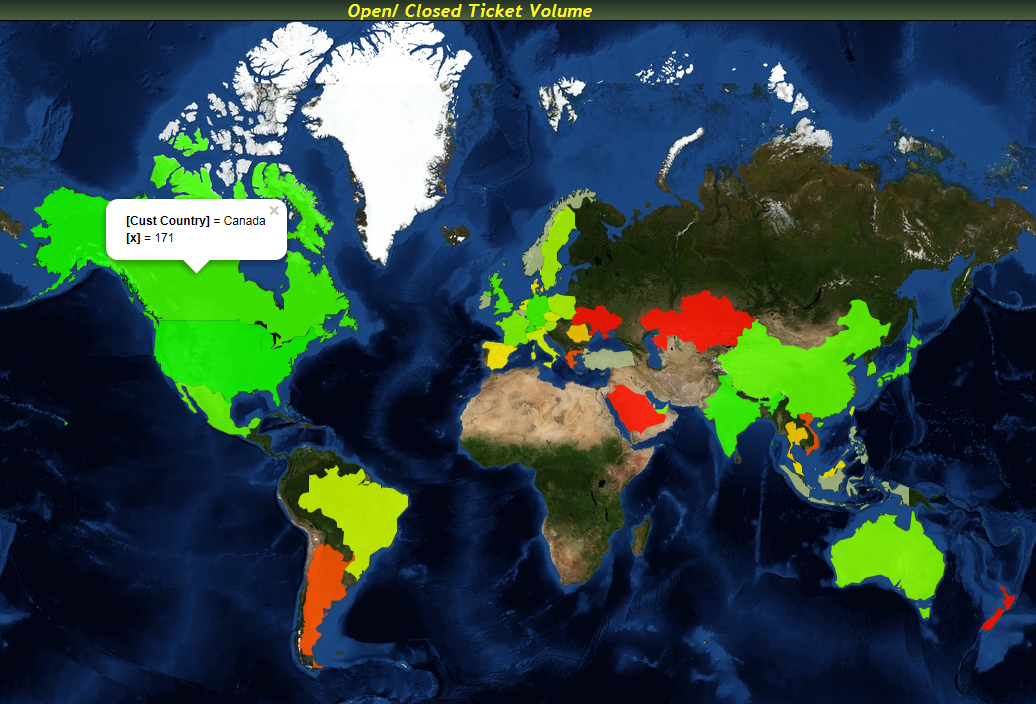
Hello everyone,
I have created this Qlikmaps application and trying to display the legend representing different color codes. How do I do it?
Thanks,
Sowhardh
- Mark as New
- Bookmark
- Subscribe
- Mute
- Subscribe to RSS Feed
- Permalink
- Report Inappropriate Content
Hello everyone,
Any ideas on how to include legend information for the Qlikmaps? 
- Mark as New
- Bookmark
- Subscribe
- Mute
- Subscribe to RSS Feed
- Permalink
- Report Inappropriate Content
Hi Sowhardh,
This is best done using a straight table. Our demo application available on our download site has a great example of how to do this. Were you able to work this out?
- Mark as New
- Bookmark
- Subscribe
- Mute
- Subscribe to RSS Feed
- Permalink
- Report Inappropriate Content
Hi Trey,
Is it possible to have gradient bar as legends Using Qlik Maps for Qlikview?
Regards,
Sabahat
- Mark as New
- Bookmark
- Subscribe
- Mute
- Subscribe to RSS Feed
- Permalink
- Report Inappropriate Content
Hi Sabahat,
To create something like the image below you would use the same expression used for the color of the polygons or points in the color for the bar chart. Here I've used a variable to keep from re-typing the expression over and over.
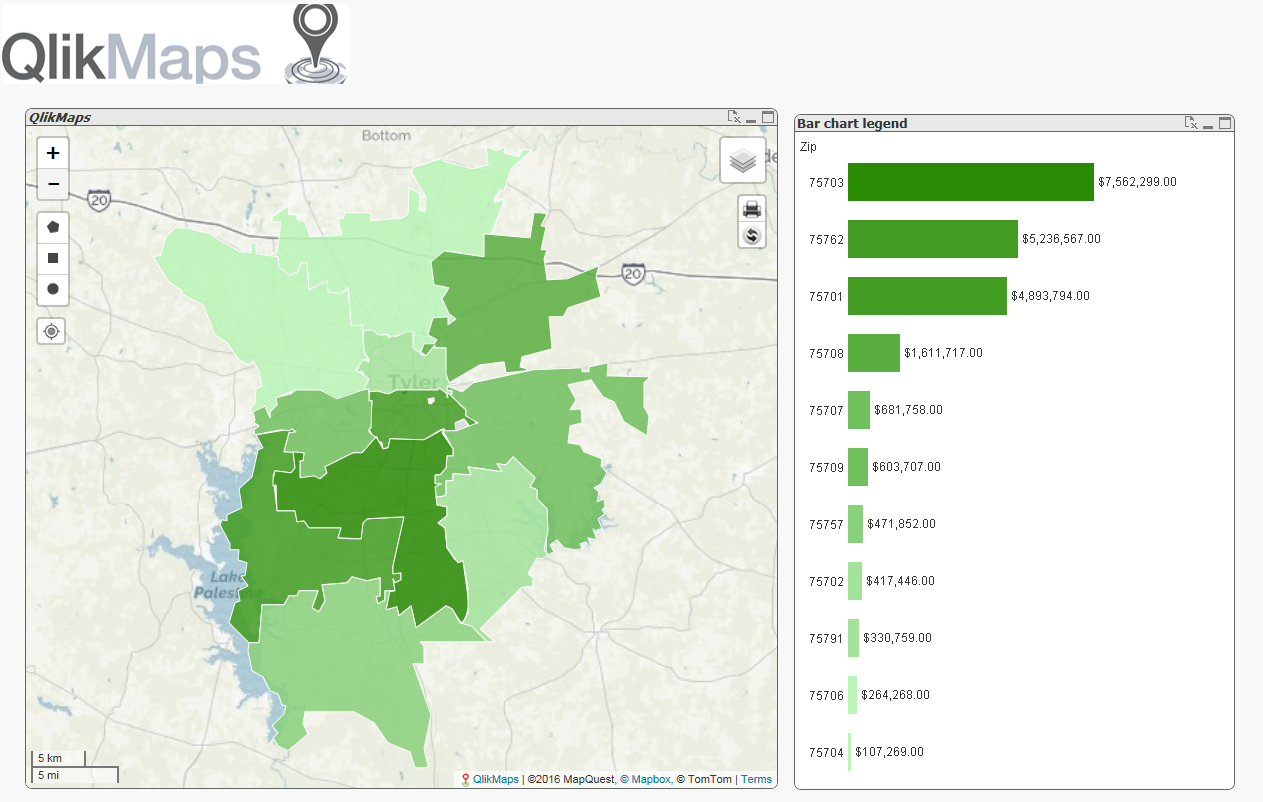
I've also attached the .qvw to so you can see how it works.
- Mark as New
- Bookmark
- Subscribe
- Mute
- Subscribe to RSS Feed
- Permalink
- Report Inappropriate Content
Hi Trey,
When I open Barcharts as legends.qvw which you sent, I just see bar chart, but not map. Can you guess the reason
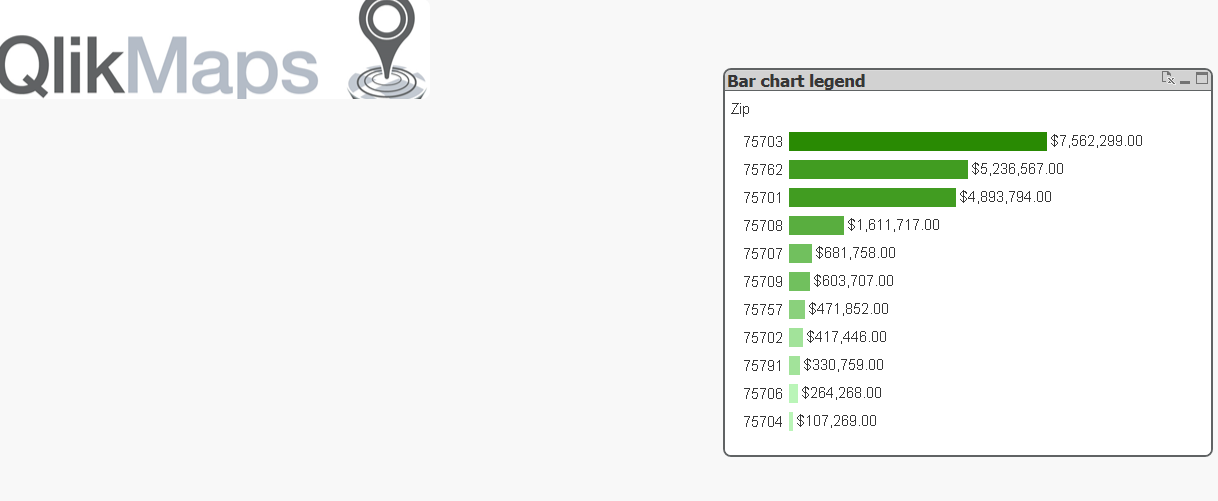
I am using IE11, QV12 and my webview mode is on.
- Mark as New
- Bookmark
- Subscribe
- Mute
- Subscribe to RSS Feed
- Permalink
- Report Inappropriate Content
Hi Kalyana,
It looks like you don't have QlikMaps installed. QlikMaps is a paid extension. You can find out more information at QlikMaps.com.
If you do own QlikMaps and are having issues displaying the map please reach out at support.analytics8.com