Unlock a world of possibilities! Login now and discover the exclusive benefits awaiting you.
- Qlik Community
- :
- All Forums
- :
- QlikView App Dev
- :
- Range for amount
- Subscribe to RSS Feed
- Mark Topic as New
- Mark Topic as Read
- Float this Topic for Current User
- Bookmark
- Subscribe
- Mute
- Printer Friendly Page
- Mark as New
- Bookmark
- Subscribe
- Mute
- Subscribe to RSS Feed
- Permalink
- Report Inappropriate Content
Range for amount
In one of my table it has Depreciation amount and ID and 20fields how to make range of data. In this table more than 150 ID need range 0-10,10-20,20-30.
ID, Dep Amount
| 1 | 9658 |
| 2 | 9856 |
| 3 | 9845 |
| 4 | 9874 |
| 5 | 9854 |
| 6 | 9852 |
| 7 | 9632 |
| 8 | 9541 |
| 9 | 9745 |
| 10 | 3698 |
Thanks
- Tags:
- jay
Accepted Solutions
- Mark as New
- Bookmark
- Subscribe
- Mute
- Subscribe to RSS Feed
- Permalink
- Report Inappropriate Content
Hi,
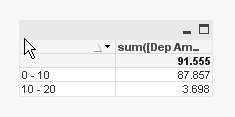
You have to replace the values of the '<= x <' because it is generated by Class function.
=Replace(Class(ID,10),'<= x <', '-')
Regards
Anand
- Mark as New
- Bookmark
- Subscribe
- Mute
- Subscribe to RSS Feed
- Permalink
- Report Inappropriate Content
Hi,
You have to create the calculated dimension and use the Class function in and straight chart or pivot chart
=Class(ID,10)
Regards
Anand
- Mark as New
- Bookmark
- Subscribe
- Mute
- Subscribe to RSS Feed
- Permalink
- Report Inappropriate Content
But it give symbols in the axis with range '<= x <' any reasons why.
Jay
- Mark as New
- Bookmark
- Subscribe
- Mute
- Subscribe to RSS Feed
- Permalink
- Report Inappropriate Content
maybe with replace, ( '<= x <' is the default)
=replace(class(ID, 10), '<= x <', '-')
- Mark as New
- Bookmark
- Subscribe
- Mute
- Subscribe to RSS Feed
- Permalink
- Report Inappropriate Content
Hi,
You have to replace the values of the '<= x <' because it is generated by Class function.
=Replace(Class(ID,10),'<= x <', '-')
Regards
Anand
- Mark as New
- Bookmark
- Subscribe
- Mute
- Subscribe to RSS Feed
- Permalink
- Report Inappropriate Content
Hi,
one suggestion. To avoid sorting issues generate a dual value after replacing '<= x <' with '-':
=Dual(Replace(Class(ID,10),'<= x <', '-'),Class(ID,10))
hope this helps
regards
Marco
- Mark as New
- Bookmark
- Subscribe
- Mute
- Subscribe to RSS Feed
- Permalink
- Report Inappropriate Content
Thanks i manage this and thanks all for good suggestions.
Jay