Unlock a world of possibilities! Login now and discover the exclusive benefits awaiting you.
- Qlik Community
- :
- All Forums
- :
- QlikView App Dev
- :
- Range of selection
- Subscribe to RSS Feed
- Mark Topic as New
- Mark Topic as Read
- Float this Topic for Current User
- Bookmark
- Subscribe
- Mute
- Printer Friendly Page
- Mark as New
- Bookmark
- Subscribe
- Mute
- Subscribe to RSS Feed
- Permalink
- Report Inappropriate Content
Range of selection
Hi,
I have a number of columns in a straight tabel to which i have added the condition, that they should only be visible if a certain year is selected.
The minimum year that I can show data from is 2010 and the 2014 is the newest (maximum) year.
I have a selection box that showes the years 2010, 2011, 2012, 2013 and 2014 - hence, when I select the years 2011 and 2012 I only see the columns that calculates for those years (2 columns). If I only choose 2013, I only get 1 column with the data from the year 2013 - so far so good.
However, when select the years 2010 and 2012, I get 3 columns, 2010, 2011 and 2012.
I have used the following expression, so please let me know, how I can make sure that the columns get shown only if the certain year is selected.
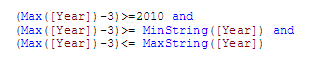
The reason it says Year-3 is that I have designet 4 columns to show at max, Max Year, Max Year-1, Max Year-2 and Max Year-3
Thanks in advance
/Martin
- Mark as New
- Bookmark
- Subscribe
- Mute
- Subscribe to RSS Feed
- Permalink
- Report Inappropriate Content
Martin
If you can change to a pivot table then this would be much simpler and easier to maintain:
- change to pivot table
- add Year as a dimension
- change the first year expression to remove the year condition and delete (or disable) the remaining expressions
- drag the Year to the top of the pivot to create year columns
Now the chart will display exactly what you select in the year list box.
If you want to display the 3 years up to the maximum possible, then add this set expression clause to your expression:
{.... <Year = {">= $(= Max({1} Year) - 3) <= $(= Max)({1} Year))"}>}
... or drop the {1} if you want the maximum selected.
HTH
Jonathan
- Mark as New
- Bookmark
- Subscribe
- Mute
- Subscribe to RSS Feed
- Permalink
- Report Inappropriate Content
Hi Jonathan,
Thanks for the answer
Pivot table is not an option for the report - and the suggestion that you have made is unfortunately not suitable for me. I would like to send you the .qvw file but the data that I work with is classified..
Any other suggestions as to how an expression can refer to selection made in a selection box?
/Martin
- Mark as New
- Bookmark
- Subscribe
- Mute
- Subscribe to RSS Feed
- Permalink
- Report Inappropriate Content
hope I understand your question; see attachment
- Mark as New
- Bookmark
- Subscribe
- Mute
- Subscribe to RSS Feed
- Permalink
- Report Inappropriate Content
Hej Massimo,
Thanks for the reply - however, I can't see the attachment, could you send it to mar10n_@hotmail.com
/Martin
- Mark as New
- Bookmark
- Subscribe
- Mute
- Subscribe to RSS Feed
- Permalink
- Report Inappropriate Content
Martin
You could do it using a straight table with 1 expression per year and a conditional show expression for each year. This is not that dynamic, as the chart will need to be manually updated one a year.
To take the same expression as before, adapted to a conditional show:
If(2013 >= Max(Year) - 3 And 2013 <= Max(Year), 1, 0)
If(2014 >= Max(Year) - 3 And 2014 <= Max(Year), 1, 0)
etc
HTH
Jonathan
- Mark as New
- Bookmark
- Subscribe
- Mute
- Subscribe to RSS Feed
- Permalink
- Report Inappropriate Content
Hi Jonathan,
Thanks Again.
Half of my Graphs are pivot tables, so for them I guess the solution will not Work.
the remaining tables are all straight tables, and for them, it seems to be working with you solution.
Thanks
/Martin