Unlock a world of possibilities! Login now and discover the exclusive benefits awaiting you.
- Qlik Community
- :
- All Forums
- :
- QlikView App Dev
- :
- RangeSum does not start at zero
- Subscribe to RSS Feed
- Mark Topic as New
- Mark Topic as Read
- Float this Topic for Current User
- Bookmark
- Subscribe
- Mute
- Printer Friendly Page
- Mark as New
- Bookmark
- Subscribe
- Mute
- Subscribe to RSS Feed
- Permalink
- Report Inappropriate Content
RangeSum does not start at zero
Hello --
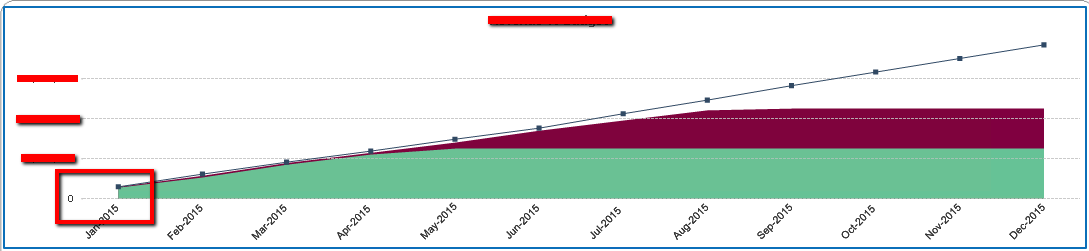
I have the following chart to accumulate budgetary/actual/forecasted sales data. As you can see in the chart, the accumulation does not start at 0. This is a very specific thing that the users are demanding. How do I make this start at 0??
This is my expression:
(RangeSum(Above(Sum({<GL_REVENUE_QUARTER=p(QUARTER),GL_REVENUE_YEAR=p(YEAR),GL_REVENUE_MONTH=p(MONTH),GL_VALUE_STREAM=p(VALUESTREAM)>} GL_BUDGET),0,RowNo())))
I am using a date island table to filter multiple graphs dates using a single filter.
I have tried unchecking supress zero values, etc. It makes no difference.
- Tags:
- rangesum
- rangesum()
- « Previous Replies
- Next Replies »
Accepted Solutions
- Mark as New
- Bookmark
- Subscribe
- Mute
- Subscribe to RSS Feed
- Permalink
- Report Inappropriate Content
- Mark as New
- Bookmark
- Subscribe
- Mute
- Subscribe to RSS Feed
- Permalink
- Report Inappropriate Content
Would you mind sharing a sample of your application?
Preparing examples for Upload - Reduction and Data Scrambling
- Mark as New
- Bookmark
- Subscribe
- Mute
- Subscribe to RSS Feed
- Permalink
- Report Inappropriate Content
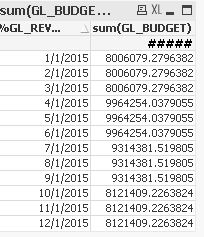
Are you sure that budget at january is 0?
- Mark as New
- Bookmark
- Subscribe
- Mute
- Subscribe to RSS Feed
- Permalink
- Report Inappropriate Content
Hi Clever --
No, there is actual budgetary data for January - but they want the chart line to start at zero.
Thanks!
- Mark as New
- Bookmark
- Subscribe
- Mute
- Subscribe to RSS Feed
- Permalink
- Report Inappropriate Content
Attached is a scrambled sample of the particular section of the app.
- Mark as New
- Bookmark
- Subscribe
- Mute
- Subscribe to RSS Feed
- Permalink
- Report Inappropriate Content
Try this, lightly different
(RangeSum(Above(Sum({<GL_REVENUE_QUARTER=p(QUARTER),GL_REVENUE_YEAR=p(YEAR),GL_REVENUE_MONTH=p(MONTH),GL_VALUE_STREAM=p(VALUESTREAM)>} GL_BUDGET),1,RowNo())))
- Mark as New
- Bookmark
- Subscribe
- Mute
- Subscribe to RSS Feed
- Permalink
- Report Inappropriate Content
Hi Clever --
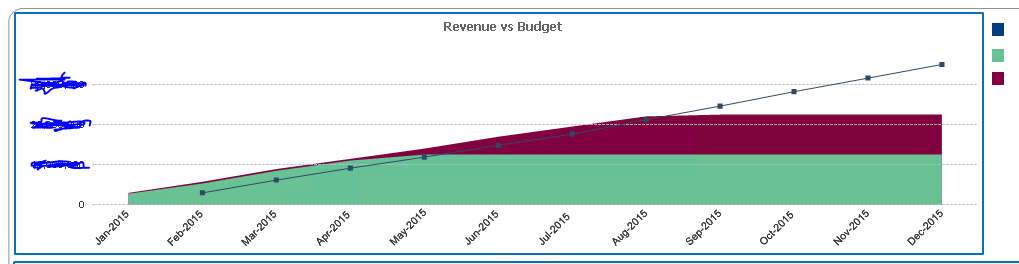
Unfortunately, this did not do it. It moved the line to the right:
- Mark as New
- Bookmark
- Subscribe
- Mute
- Subscribe to RSS Feed
- Permalink
- Report Inappropriate Content
Because, Jan = 0, right?
Uncheck "Supress Zero - Values" into Presentation tab
- Mark as New
- Bookmark
- Subscribe
- Mute
- Subscribe to RSS Feed
- Permalink
- Report Inappropriate Content
Hi Clever --
This worked but now the accumulation does not total to the true total. How can I get around that?
Thanks!
- Mark as New
- Bookmark
- Subscribe
- Mute
- Subscribe to RSS Feed
- Permalink
- Report Inappropriate Content
Well, what´s the 'true total'?
As I can see you have BUDGET for each quarter, but wants to see for each month.
What values you want to see on each month?
- « Previous Replies
- Next Replies »