Unlock a world of possibilities! Login now and discover the exclusive benefits awaiting you.
- Qlik Community
- :
- All Forums
- :
- QlikView App Dev
- :
- RangeSum does not start at zero
- Subscribe to RSS Feed
- Mark Topic as New
- Mark Topic as Read
- Float this Topic for Current User
- Bookmark
- Subscribe
- Mute
- Printer Friendly Page
- Mark as New
- Bookmark
- Subscribe
- Mute
- Subscribe to RSS Feed
- Permalink
- Report Inappropriate Content
RangeSum does not start at zero
Hello --
I have the following chart to accumulate budgetary/actual/forecasted sales data. As you can see in the chart, the accumulation does not start at 0. This is a very specific thing that the users are demanding. How do I make this start at 0??
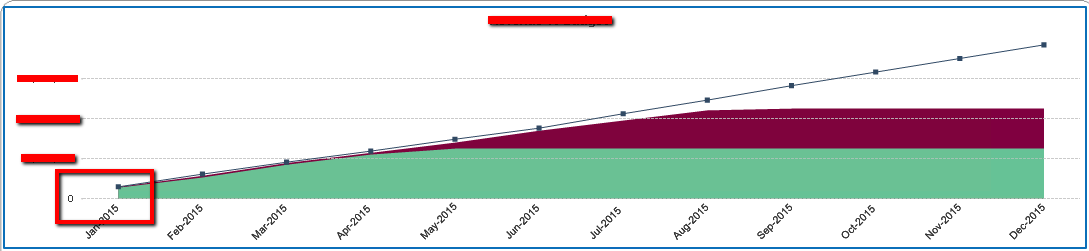
This is my expression:
(RangeSum(Above(Sum({<GL_REVENUE_QUARTER=p(QUARTER),GL_REVENUE_YEAR=p(YEAR),GL_REVENUE_MONTH=p(MONTH),GL_VALUE_STREAM=p(VALUESTREAM)>} GL_BUDGET),0,RowNo())))
I am using a date island table to filter multiple graphs dates using a single filter.
I have tried unchecking supress zero values, etc. It makes no difference.
- Tags:
- rangesum
- rangesum()
- « Previous Replies
- Next Replies »
- Mark as New
- Bookmark
- Subscribe
- Mute
- Subscribe to RSS Feed
- Permalink
- Report Inappropriate Content
It worked... Bu tI don´t know how to fit this inside your model
- Mark as New
- Bookmark
- Subscribe
- Mute
- Subscribe to RSS Feed
- Permalink
- Report Inappropriate Content
PFA
- Mark as New
- Bookmark
- Subscribe
- Mute
- Subscribe to RSS Feed
- Permalink
- Report Inappropriate Content
How did you do it?
- Mark as New
- Bookmark
- Subscribe
- Mute
- Subscribe to RSS Feed
- Permalink
- Report Inappropriate Content
I´ve attached my example,
I´ve concatenated an "empty" line to the table
As "" is sorted first, it comes at first position (important to unmark Supress Zero-Values)
- Mark as New
- Bookmark
- Subscribe
- Mute
- Subscribe to RSS Feed
- Permalink
- Report Inappropriate Content
Ok, I think I see.
So, you essentially load a row of data with 0 with a blank date dimension. Then when I chart this, the blank should show up first.
I'll have to figure out a way to handle this with my date table though.
- Mark as New
- Bookmark
- Subscribe
- Mute
- Subscribe to RSS Feed
- Permalink
- Report Inappropriate Content
Maybe
LOAD Distinct
'' as %GL_REVENUE_DATE,
GL_VALUE_STREAM,
0 as GL_BUDGET,
CUSTNO
Resident GL_REVENUE_BUDGET;
- Mark as New
- Bookmark
- Subscribe
- Mute
- Subscribe to RSS Feed
- Permalink
- Report Inappropriate Content
OK - so what I ended up having to do is create that blank record in all the budget/actual tables and in master calendar tables as well. After doing this, turning off suppress missing and selecting "show all values" under the chart dimension settings it properly starts at 0.
Yikes...
Thanks man!
- Mark as New
- Bookmark
- Subscribe
- Mute
- Subscribe to RSS Feed
- Permalink
- Report Inappropriate Content
Good to read it  , perfect for a friday "TGIF"
- « Previous Replies
- Next Replies »