Unlock a world of possibilities! Login now and discover the exclusive benefits awaiting you.
- Qlik Community
- :
- All Forums
- :
- QlikView App Dev
- :
- Rank function showing all 1s
- Subscribe to RSS Feed
- Mark Topic as New
- Mark Topic as Read
- Float this Topic for Current User
- Bookmark
- Subscribe
- Mute
- Printer Friendly Page
- Mark as New
- Bookmark
- Subscribe
- Mute
- Subscribe to RSS Feed
- Permalink
- Report Inappropriate Content
Rank function showing all 1s
G'day All,
This is a similar question to this, https://community.qlikview.com/thread/51784, which was never answered.
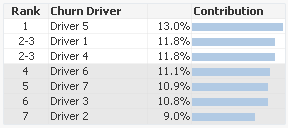
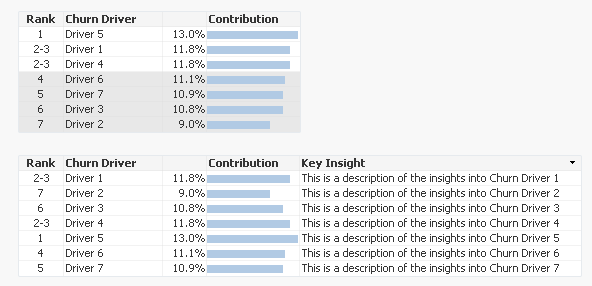
I have some client churn information that I am attempting to place in a straight table chart. I need to sort them in order of contribution and then highlight the top three drivers (by shading all the others). I am successfully using the Rank function to achieve the shading.
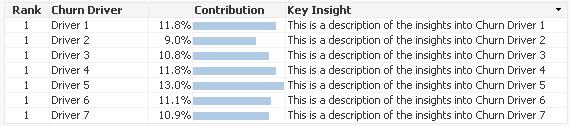
This is looking good, but then I need to add an extra description column for the key insights and now the Rank function returns all 1s and the table sort stops working.
Can someone please explain how to fix this problem? I suspect I need to use the Aggr function to cater for the extra dimension, but I have not been able to find any information that explains this issue.
Thanks in advance.
Cheers,
Barnaby.
- Tags:
- rank
- rank_function
Accepted Solutions
- Mark as New
- Bookmark
- Subscribe
- Mute
- Subscribe to RSS Feed
- Permalink
- Report Inappropriate Content
- Mark as New
- Bookmark
- Subscribe
- Mute
- Subscribe to RSS Feed
- Permalink
- Report Inappropriate Content
May be this:
Rank( TOTAL avg( Contribution))
- Mark as New
- Bookmark
- Subscribe
- Mute
- Subscribe to RSS Feed
- Permalink
- Report Inappropriate Content
Thanks Sunny - that's it. After seeing this, I re-read the help on the Rank function and I now understand it. I found it completely cryptic beforehand.
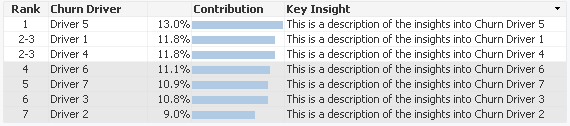
I now have what I need.
Cheers,
Barnaby.