Unlock a world of possibilities! Login now and discover the exclusive benefits awaiting you.
- Qlik Community
- :
- All Forums
- :
- QlikView App Dev
- :
- Re: Remove Null Line in Line Chart
- Subscribe to RSS Feed
- Mark Topic as New
- Mark Topic as Read
- Float this Topic for Current User
- Bookmark
- Subscribe
- Mute
- Printer Friendly Page
- Mark as New
- Bookmark
- Subscribe
- Mute
- Subscribe to RSS Feed
- Permalink
- Report Inappropriate Content
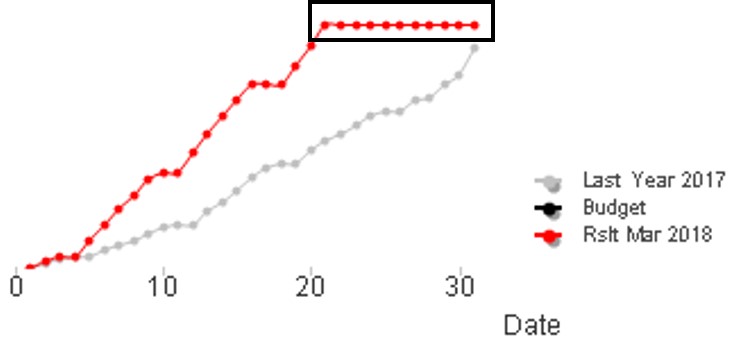
Remove Null Line in Line Chart
Hello All,
I have one questions, how to remove line in line chart, if value is null?
Please see picture which is in black box.
Thank you all.
- Mark as New
- Bookmark
- Subscribe
- Mute
- Subscribe to RSS Feed
- Permalink
- Report Inappropriate Content
What is the expression that you are using for Rslt Mar 2018?
- Mark as New
- Bookmark
- Subscribe
- Mute
- Subscribe to RSS Feed
- Permalink
- Report Inappropriate Content
Hello Sunny,
Here's my expression for Rslt Mar 2018
sum({<Date_Fix={">=$(=MonthStart(AddMonths(max({<DESC= {'Sales'}>}Date_Fix),0)))<=$(=AddMonths(max({<DESC= {'Sales'}>}Date_Fix),0))"},tyear,tmonth,tdate>}sales_qty)
- Mark as New
- Bookmark
- Subscribe
- Mute
- Subscribe to RSS Feed
- Permalink
- Report Inappropriate Content
And is this doing full accumulation?
- Mark as New
- Bookmark
- Subscribe
- Mute
- Subscribe to RSS Feed
- Permalink
- Report Inappropriate Content
Yess, comparing with last year with fully accumulation by month, problem is when this month didn't reach end of month, the line become straight with same value.
- Mark as New
- Bookmark
- Subscribe
- Mute
- Subscribe to RSS Feed
- Permalink
- Report Inappropriate Content
Remove 'full accumulation' and try one of these
RangeSum(Above(Sum({<Date_Fix = {">=$(=MonthStart(AddMonths(max({<DESC= {'Sales'}>}Date_Fix), 0)))<=$(=AddMonths(max({<DESC= {'Sales'}>}Date_Fix),0))"}, tyear, tmonth, tdate>} sales_qty), 0, RowNo()))
or
If(Sum({<Date_Fix = {">=$(=MonthStart(AddMonths(max({<DESC= {'Sales'}>}Date_Fix), 0)))<=$(=AddMonths(max({<DESC= {'Sales'}>}Date_Fix),0))"}, tyear, tmonth, tdate>} sales_qty) > 0,
RangeSum(Above(Sum({<Date_Fix = {">=$(=MonthStart(AddMonths(max({<DESC= {'Sales'}>}Date_Fix), 0)))<=$(=AddMonths(max({<DESC= {'Sales'}>}Date_Fix),0))"}, tyear, tmonth, tdate>} sales_qty), 0, RowNo())))